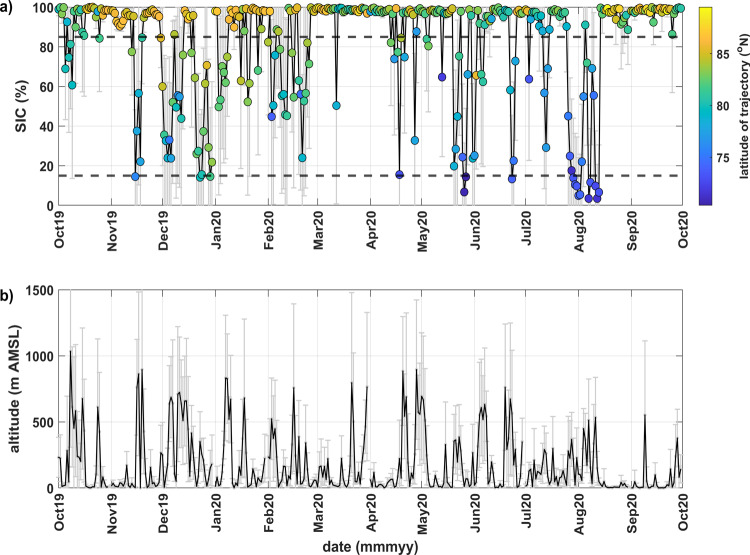
Fig. 3. Spatial properties of airmass transport pathways to Polarstern.
a The average sea ice concentration (SIC) along each 3-day airmass backward trajectory endpoint. Trajectories were initiated daily at 00:00 UTC and at 30 m above mean sea level (AMSL) above Polarstern with endpoints every 6 h back in time. The dashed lines indicate the thresholds for pack ice (85–100%), the marginal ice zone (15–85%), and ice-free ocean or land (0–15%). Threshold definitions were obtained from the Norwegian Polar Institute (https://www.npolar.no/en/themes/the-marginal-ice-zone/). b Corresponding altitude along each 3-day trajectory averaged at all end points. Error bars indicated standard deviation of the daily averages.

