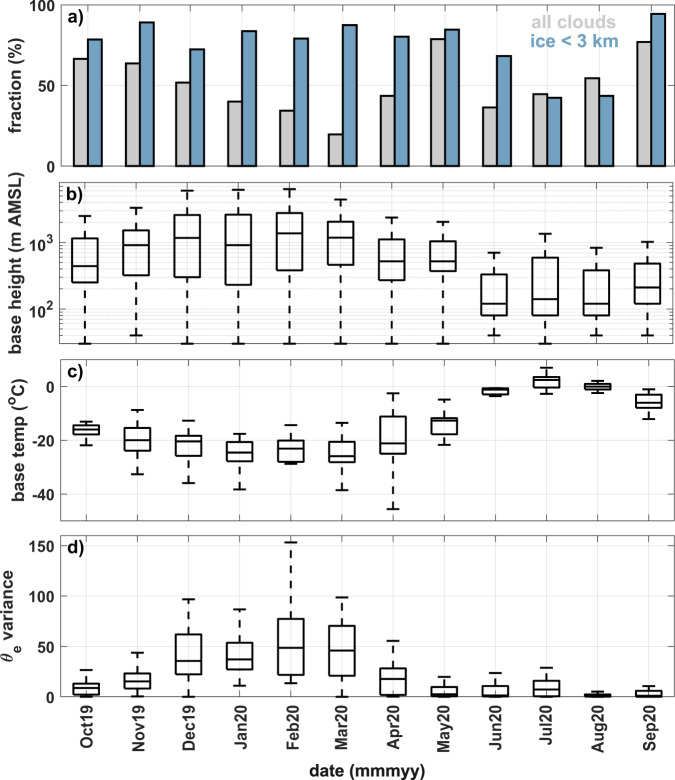
Fig. 6. Annual cycle of clouds and atmospheric stratification during the Multidisciplinary drifting Observatory for the Study of Arctic Climate (MOSAiC).
Data include monthly averaged: a cloud fraction and cloud ice fractional occurrence below 3 km AMSL, b cloud-base height, c cloud-base temperature (temp), and d vertical variance of sub-cloud equivalent potential temperature (θe). For b–d, the central mark indicates the median, and the bottom and top edges of the box indicate the 25th and 75th percentiles, respectively. The whiskers extend to the most extreme data points not considered outliers.

