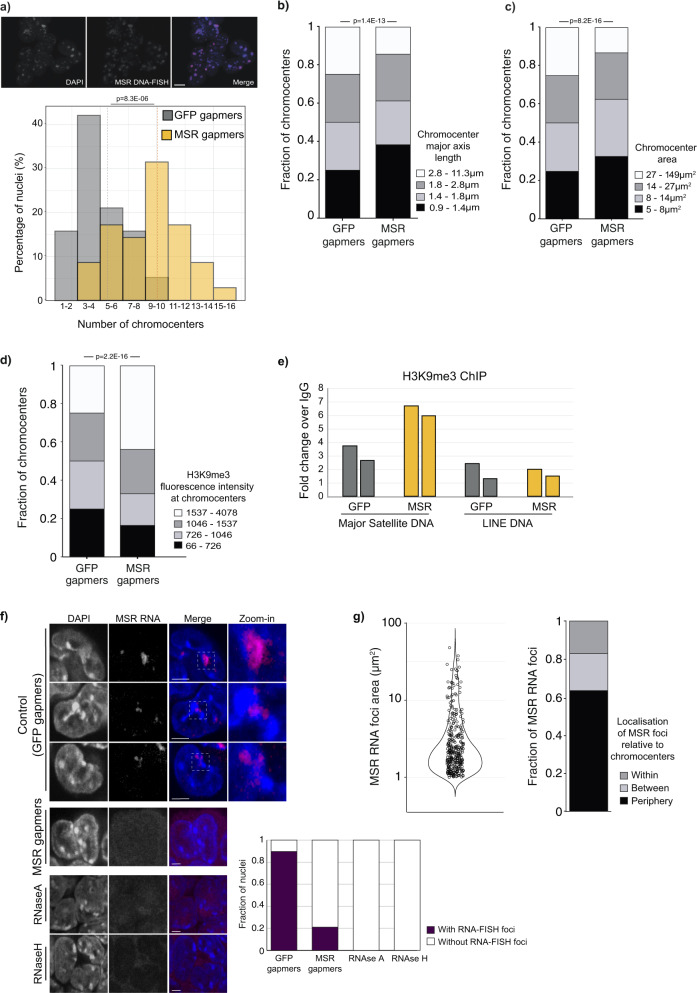
Fig. 4. Degradation of satellite transcripts induces chromatin remodelling in embryonic stem cells.
a Top: ESCs labelled with DAPI (blue) or major satellite DNA-FISH probe (red). Bottom: Percentage of nuclei containing different numbers of chromocenters scored by DAPI in ESCs transfected with GFP (n = 774 nuclei) or MSR (n = 1084 nuclei) gapmers. N = 3 independent experiments, compared using a two-sided Mann–Whitney test. Dashed vertical lines, mean chromocenter number per condition. Scale bar, 10 μm. b, c Major axis length (b) and area (c) of chromocenters. Measurements were made of individual chromocenters at their mid-point in n = 774 and n = 1084 nuclei, following the transfection of ESCs with GFP or MSR gapmers, respectively. Data were binned into quartiles and the changes in the MSR fractions were compared to the GFP control. N = 3 independent experiments, compared using a two-sided Mann–Whitney test. d Quantification of H3K9me3 immunofluorescence intensity at chromocenters that were defined as DAPI-large foci, at the optimal focal plane for each chromocenter. A total of n = 3209 and n = 2849 chromocenters were quantified following N = 2 independent GFP and MSR gapmer transfection experiments, respectively. Data were binned into quartiles, and the fractions of H3K9me3 intensities at chromocenter in the MSR condition compared using a two-sided Mann–Whitney test. e ChIP-qPCR data show the fold-change over IgG of the H3K9me3 signal at MSR DNA or LINE DNA following GFP or MSR gapmer ESC transfections. N = 2 biologically independent samples are shown. f RNA-FISH single-section images show the distribution of major satellite RNA in ESCs following treatment with GFP gapmers (control) or MSR gapmers, or upon RNaseA or RNaseH treatment. Scale bars, 5 μm. White boxes indicate zoomed-in areas shown to the right. Chart shows the proportion of nuclei with MSR RNA foci in the different treatment conditions (n = 127 nuclei in GFP and n = 114 in MSR gapmer samples; and n = 50 in each of the RNAse-treated samples, from N = 2 independent experiments). g Left, MSR RNA foci areas at their mid-point in ESC nuclei. Right, their localisation in relation to chromocenters. MSR RNA foci (n = 331) were measured in n = 127 nuclei from N = 2 biologically independent GFP gapmer-treated experiments. See also Supplementary Fig. 4 and Supplementary Movie 8 .

