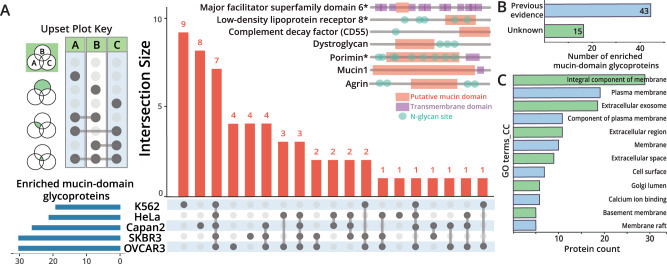
Fig. 4. Analysis of mucin-domain glycoproteins from cell line enrichments.
A Upset plot comparing enriched mucin lists from five cell lines. The total number of enriched mucin-domain glycoproteins from each cell line is shown on the bottom left (blue horizontal bars). If a group of mucin-domain glycoproteins was only seen in one cell line, only one gray dot is darkened; the number of proteins that are only seen in that cell line are shown in bar graph form above. Overlap between samples are shown by multiple darkened gray dots and a line connecting them. A total of seven mucin-domain glycoproteins were seen in all five cell lines; these proteins are shown above the Upset plot. The seven proteins found in all five samples are shown above the plot; putative mucin domain (orange), transmembrane domains (purple), and N-glycan sites (green) are annotated based on Uniprot assignments (transmembrane domain, N-glycan sites) and the mucin-domain candidacy algorithm (mucin domain). B Discovery of new mucin glycoproteins. The total list of enriched mucin proteins was searched against the SimpleCell dataset51. If O-glycopeptides within the assigned mucin domains were found in this dataset, a protein was considered as a previously described mucin-domain glycoprotein; if not, it was considered a previously undescribed mucin-domain glycoprotein. C Mucin GO term enrichment. Enriched cellular component (CC) GO_terms using DAVID55,56 are shown with protein count indicated on the x-axis. Source data are in Supplementary Data 4 and 5.

