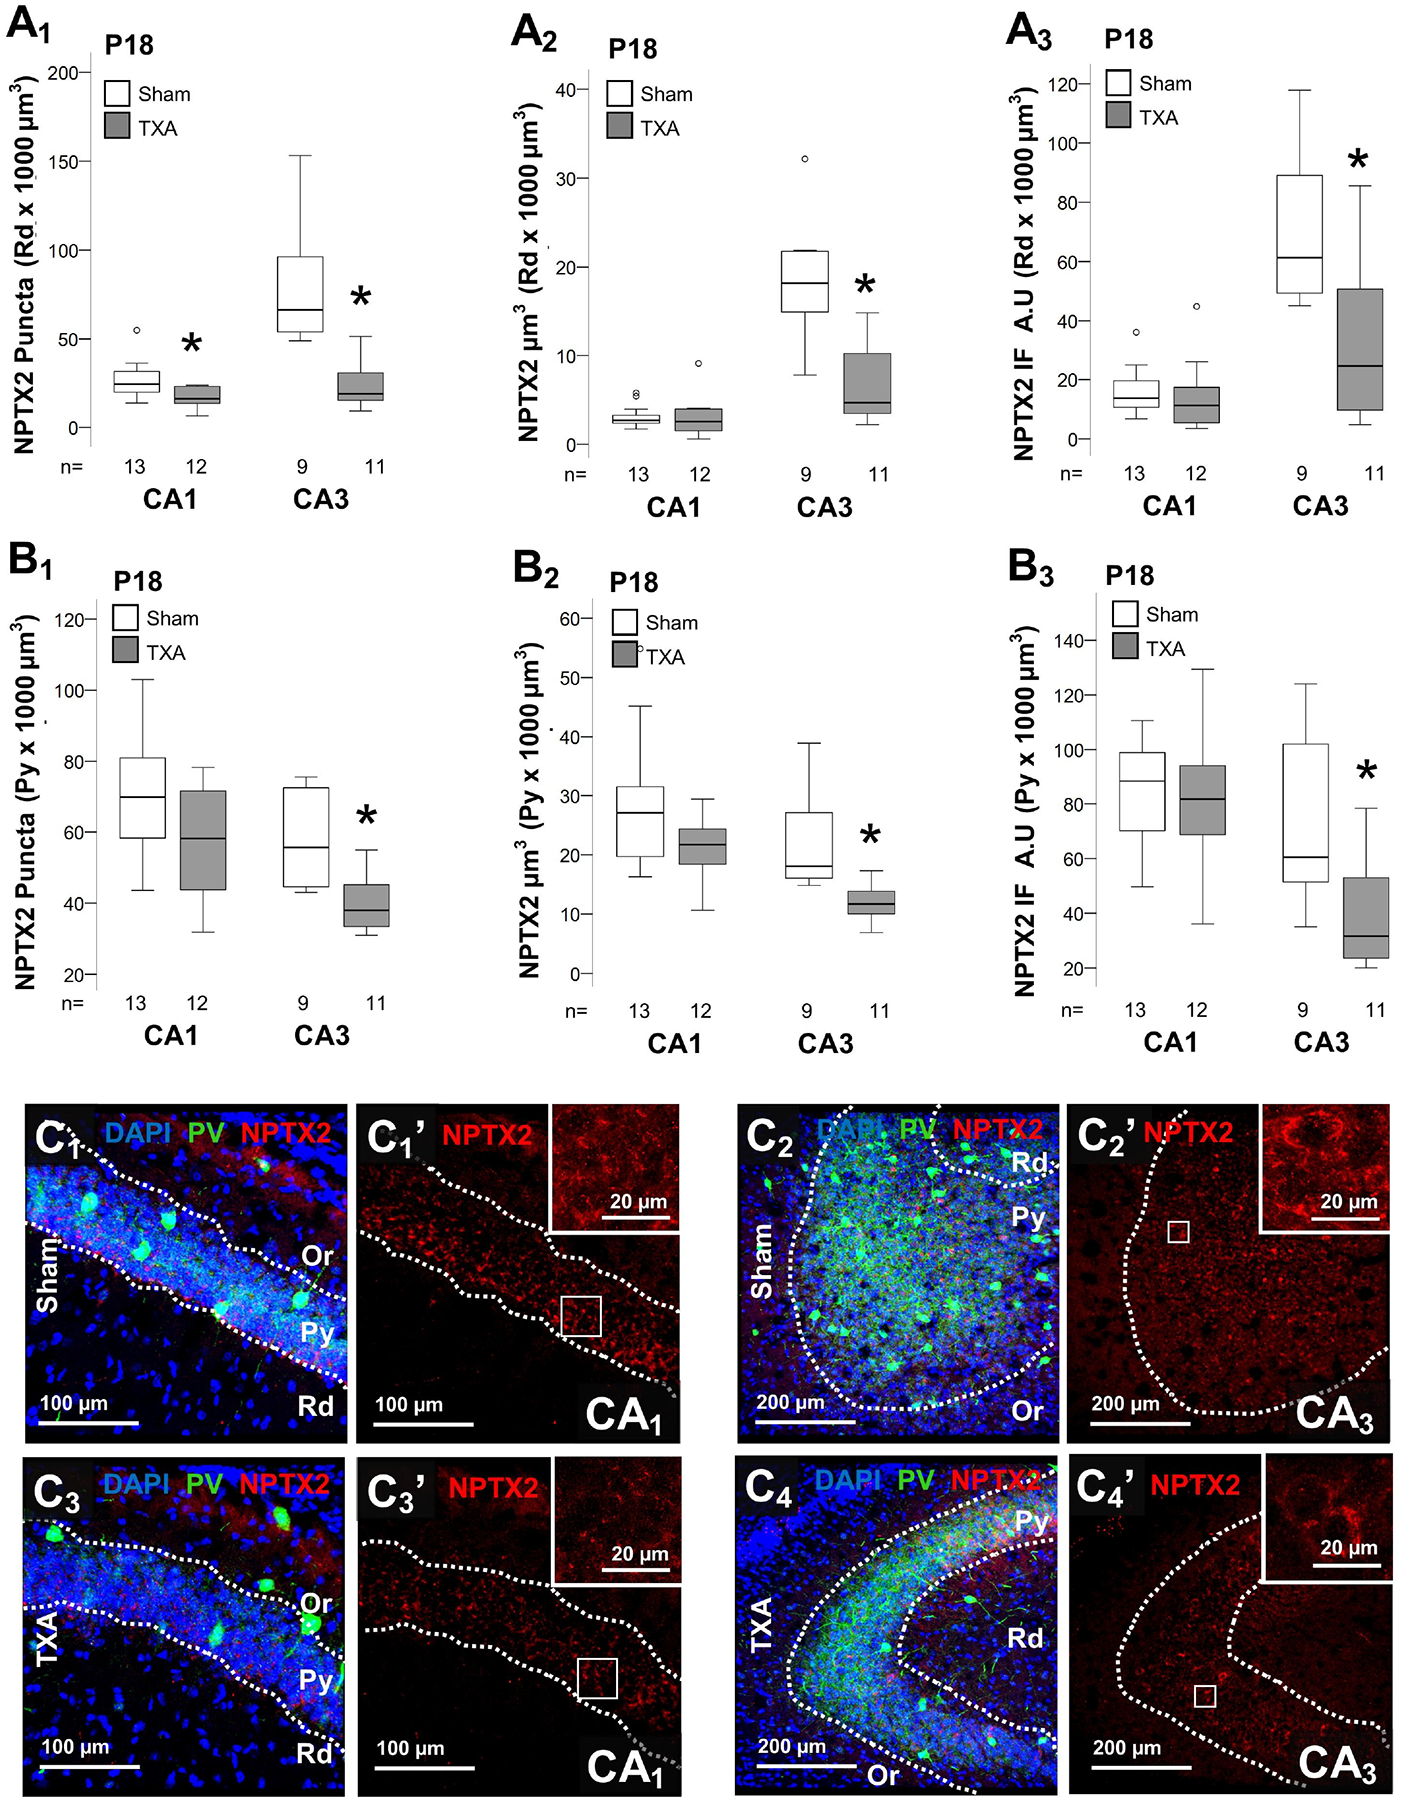
Figure 4. Decrease NPTX2 levels in the CA3 in IUGR mice at P18.

Analysis performed in z-stacks captured from double immunolabeling detecting PV IR in green (Alexa 488 goat anti chicken) and NPTX2 IR in red (Alexa 568 goat anti rabbit), and DAPI nuclear staining in dorsal hippocampus. Box and whiskers plots represent NPTX2 number of puncta per 103 μm3 (A1 & B1), total volume (μm3 × 103 μm3; A2& B2) and total IF (A.U. × 103 μm3; A3 & B3) at P18 in CA1 and CA3. Analysis segmented for Rd (A), and Py (B) layers of the dorsal CA1 and CA3. Boxes are limited by the 75th and 25th percentiles (interquartile range, IQR) and whiskers are limited by the last data point within 1.5 times the IQR from the median (continuous line inside the box), with outliers represented as °. Mann-Whitney U test was applied to compared experimental groups. *, p < 0.05. Unbiased image processing and analysis was performed using Imaris x64 v9.8 software blinded to treatments, sex and time. Representative reconstruction renderings from z-stacks using Zen blue software in CA1 (C1 & C3) and CA3 (C2 & C4). A.U., arbitrary units; CA, cornus ammonis; IF, immunofluorescence; Or, Oriens Layer; P, post-natal age; pcta, puncta; PV, parvalbumin; Py, pyramidal cell layer; Rd, Radiatum layer.
