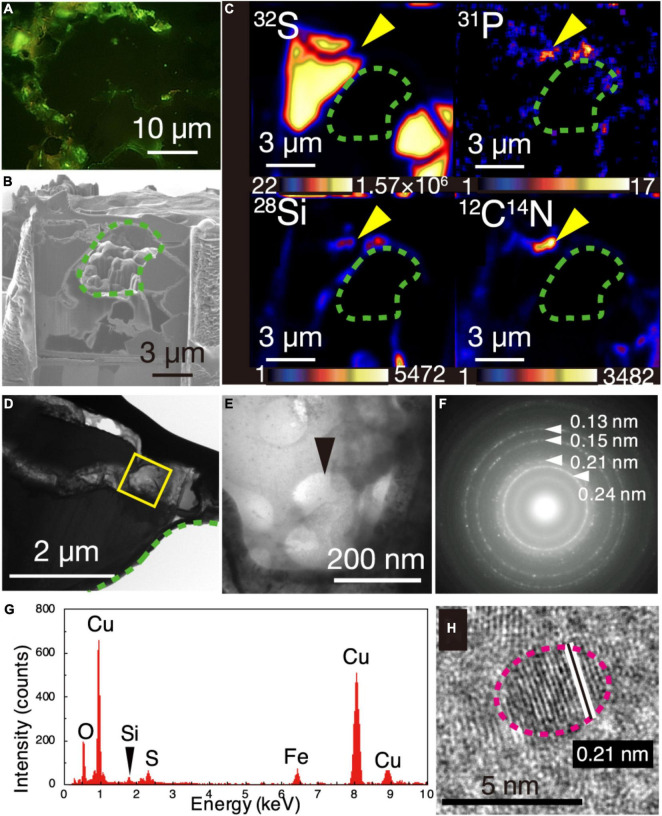
FIGURE 2.
Visualization of microbial cells associated with Cu-bearing nanocrystals in chalcopyrite grain boundaries. (A) Fluorescence microscopy image of a grain boundary with greenish cell-like signals where a 150-nm thick FIB section was fabricated. (B) Ga ion image of a 150-nm thick FIB section of the grain boundary shown in (A). A green dotted line shows a hole corresponding to chalcopyrite grains in the FIB section. (C) NanoSIMS images of the 150-nm thick FIB section with intensity color contours. Yellow arrows indicate the region presented in (E). (D) TEM image of a ribbon-shaped grain boundary of a 150-nm thick FIB section. A yellow square indicates the same region presented in (E). (E) TEM image of small spheres. (F) Selected area electron diffraction pattern from the small spheres in (E). Arrows indicate ring patterns with interplanar spacings. (G) Energy dispersive X-ray spectrum from the small spheres. (H) High-resolution TEM image of crystalline nanoparticles in the region pointed by a black arrow in (E). White lines indicate lattice fringes of a nanocrystal with the rim indicated by a pink dotted line.

