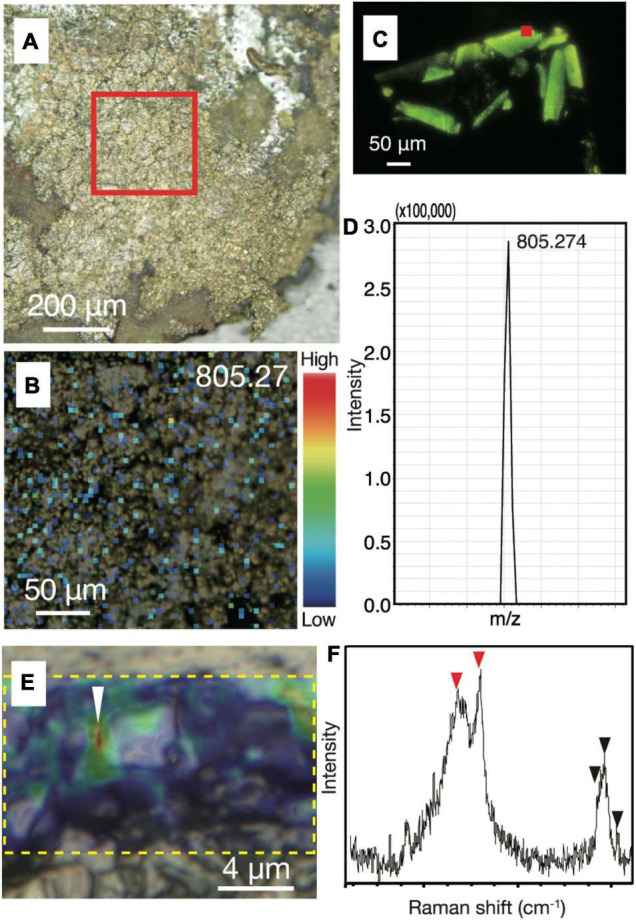
FIGURE 4.

Biological signatures determined by imaging mass spectrometry and Raman spectroscopy from chalcopyrite grain boundaries. (A) Reflection light microscope image of inner chalcopyrite wall. The red square highlights the region observed at a higher magnification in Figure 3B. (B) Mapping image of a macromolecule at with m/z = 805.27 by imaging mass spectrometry analysis with an intensity color contour. (C) Fluorescence microscopy image of a DNA-stained section from cultured cells of an archaeon (Thermococcus kodakarensis). The red square indicates a spot where a mass spectrum was obtained. (D) Mass spectrum focusing on a peak at m/z = 805.274 obtained from the spot indicated by the red square in Figure 3C. (E) Optical microscope image overlapped with a Raman spectroscopy mapping image of the peak intensity at 2,800–3,000 cm– 1, as highlighted by a yellow dotted rectangle. (F) Raman spectrum obtained from the region indicated by a white arrow in Figure 3E. Red arrows indicate peaks not found in the resin or minerals spatially associated with the small spheres, while back arrows indicate peaks also found in the resin (Supplementary Figures 5, 6).
