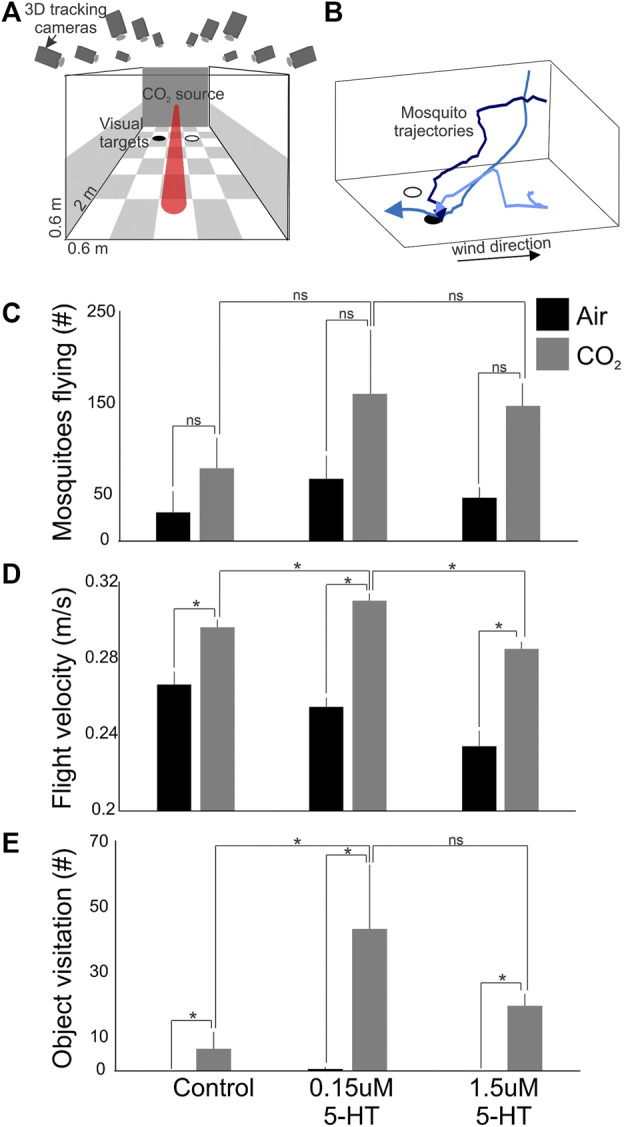
FIGURE 2.

Flight activity and response to visual objects of A. stephensi following 5-HT provisioning in a bloodmeal. (A) Wind tunnel and associated computer vision system for real-time tracking of mosquito behaviors. (B) Example mosquito trajectories. After encountering the CO2 plume, mosquitoes increase their flight velocity and become sensitized to visual objects, like a black circle. (C) The numbers of mosquitoes flying in the wind tunnel during exposure to clean air (black histogram) and CO2 (grey histograms) for different treatments (control, 0.15 µM 5-HT, and 1.5 µM 5-HT). (D) Same as in (C), except for the flight velocities of the mosquito tracks. (E) Same as in (C), except for the numbers of mosquitoes that investigated attractive visual objects on the floor of the wind tunnel. Bars are the mean ± sem; *p < 0.05; and ns > 0.05 (Kruskal-Wallis test with Tukey post hoc test).
