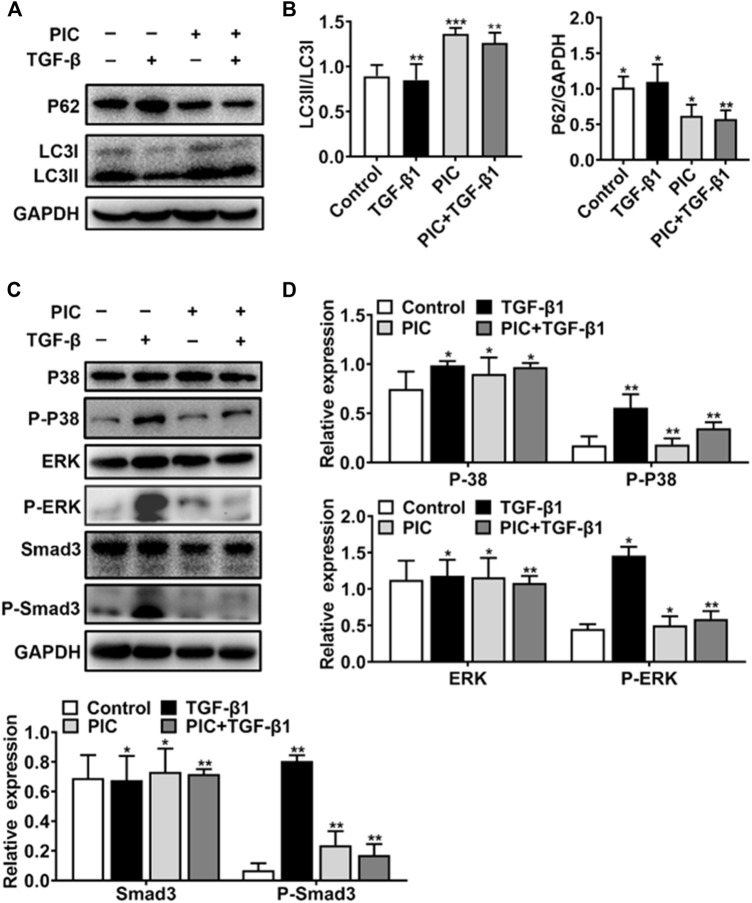
FIGURE 3.
(A) Protein expressions of LC3I, LC3II, P62, and GAPDH in NIH-3T3 cells treated with 5 ng/ml TGF-β1 with or without PIC (4 μM) for 24 h (B) Quantitative Western blot analysis of α-SMA, LC3I, LC3II, and GAPDH in different groups. (C) Protein expressions of p-Smad3, Smad3, p-ERK, ERK, P-P38, and P38, in NIH-3T3 cells treated with 5 ng/ml TGF-β1 with or without PIC (4 μM) for 1 h. (D) Quantitative Western blot analysis of p-Smad3, Smad3, p-ERK, ERK, p-P38, and P38 in different groups. Data are expressed as mean ± SD, n = 3. *p < 0.05, **p < 0.01, and ***p < 0.001.

