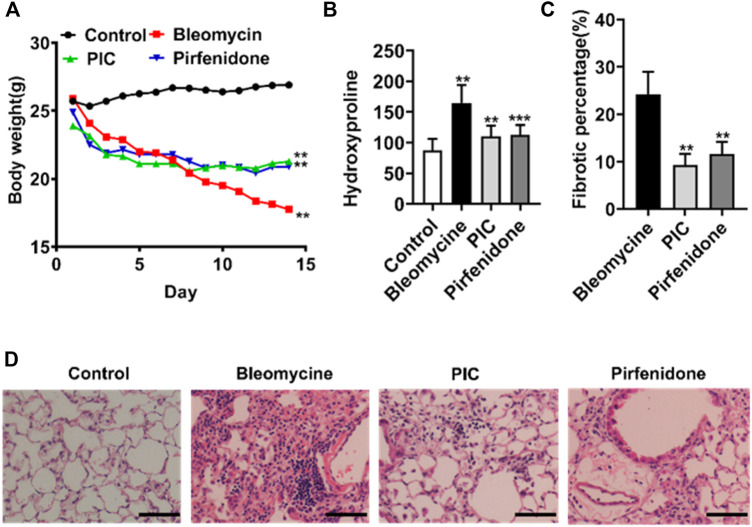
FIGURE 4.
(A) Representative images showing the weight changes of therapeutic dosing of 10 mg/kg PIC in mice with the established bleomycin-induced pulmonary fibrosis model. (B) Hydroxyproline content of lung tissues from indicated groups of mice. (C,D) Hematoxylin-eosin staining and pulmonary fibrosis area of lung sections from the indicated groups of mice. Scale bars, 100 µm. Data are expressed as mean ± SD, n = 6. **p < 0.01.

