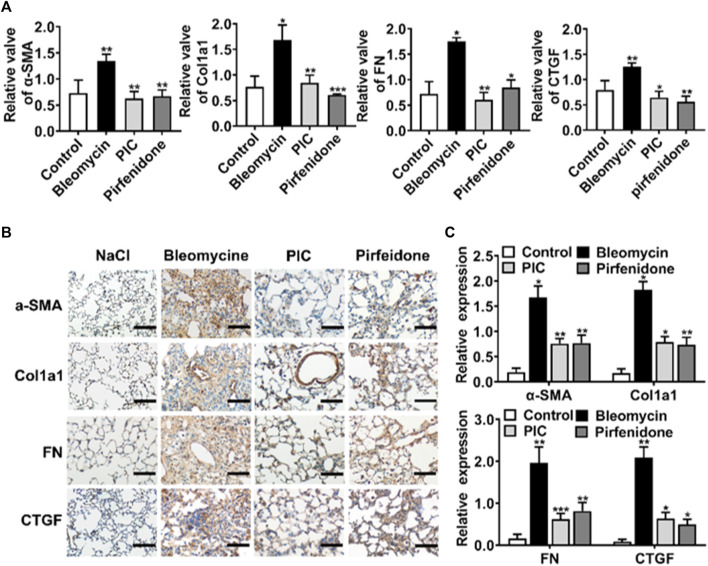
FIGURE 5.
(A) mRNA expression levels of α-SMA, Col1a1, FN, and CTGF in lung homogenates of indicated groups. (B) Representative images showing immunohistochemical staining of α-SMA, Col1a1, FN, and CTGF of lung sections from the indicated groups of mice and images at 200× magnification. (C) Expressions of protein were performed by ImageJ in different groups. Data are expressed as mean ± SD, n = 6. *p < 0.05, **p < 0.01, and ***p < 0.001.

