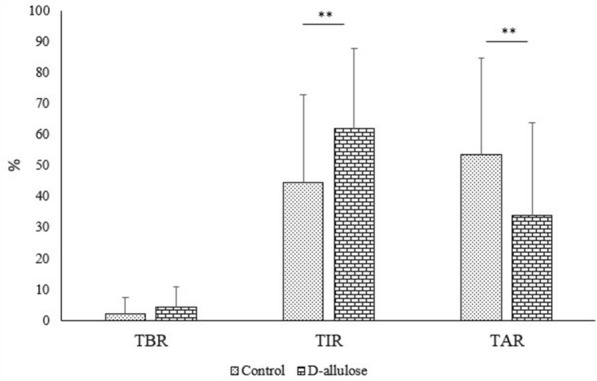
Fig. 4.

The effect of D-allulose during the consumption period compared to control period on the percentage of time postprandial glucose in-target range (%TIR), percentage of time glucose above-target range (%TAR) and percentage of time glucose below-target range (%TBR). Percentages of TIR, TAR and TBR were analyzed by obtaining the average of frequency glucose in TIR, TAR and TBR for 5 days (control and consumption periods) at 15 to 180 min after iftar. The average then divided by 12 times point and multiple with 100. Data reported as mean ± SD. There were significant differences of postprandial glucose between both periods (**p < 0.01)
