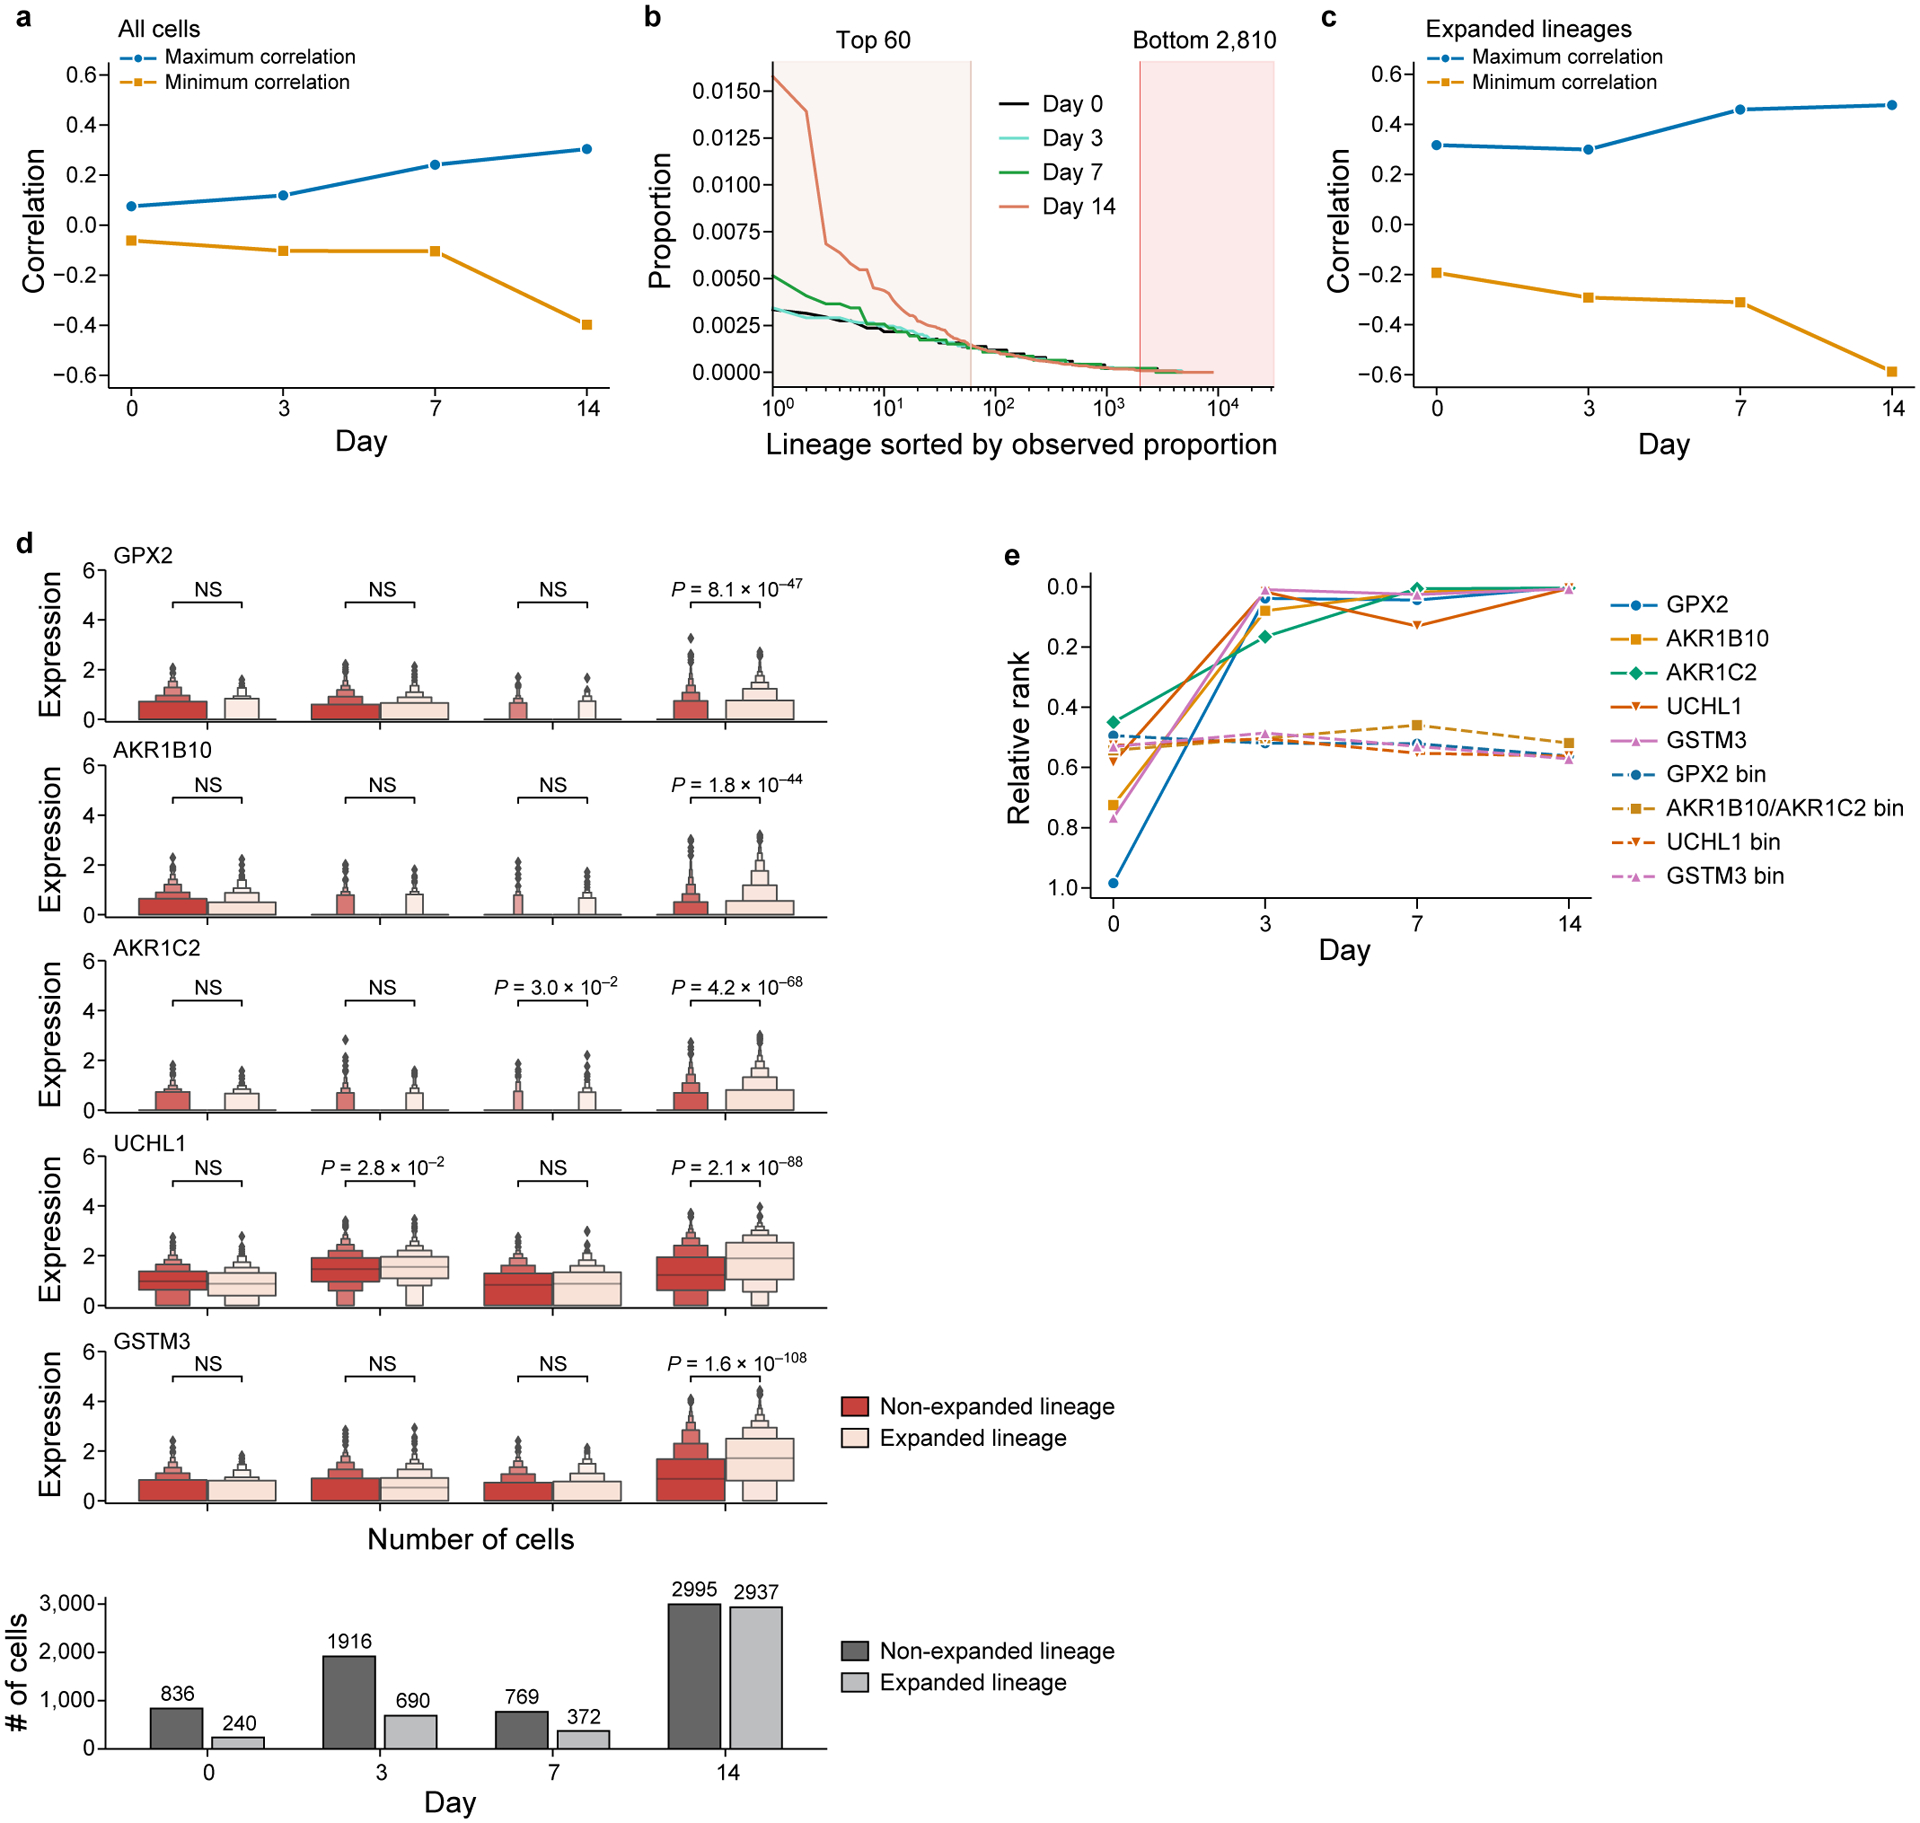
Extended Data Figure 6. Correlation between clone size at day 14 and gene expression.

a. Gene expression is progressively more predictive of persister lineages over time. For each timepoint (x axis), maximum (blue) and minimum (orange) over the correlation coefficients (y axis) of each gene and the lineage size at day 14 (also see Fig. 2g). b. Choosing expanded and no-expanded lineages for gene expression comparisons. Cut-offs (vertical lines) for highly expanded and non-expanded lineages on day 14 based on the estimated proportion of each lineage in the population (y axis), sorted by decreasing proportion (x axis, log scale) for each timepoint (colored lines). c. For each timepoint (x axis), maximum (blue line) and minimum (orange line) over the correlation coefficients (y axis) of each gene and the lineage size at day 14 as in (a), but restricted to cells of highly expanded lineages as in (b). d. Genes with top correlation to lineage expansion. Top five rows: distribution of gene expression of top correlated genes (log normalized counts, y axis) at each time point (x axis), comparing cells from non-expanded (red) and expanded (pink) lineages, as defined in (b). Bottom row: numbers of cells (y axis) per timepoint in non-expanded, (dark gray) and expanded (light gray) lineages. Distributions are visualized as enhanced box plots indicating median (gray bar) and geometric progression of quantiles (progressively decreasing box widths for 75th, 87.5th, 93.75th, 96.875th, etc. percentiles, and analogously for 25th, 12.5th, 6.25th, 3.125th, etc. percentiles, labeling up to 1.5625% of the data as outliers). Bonferroni-Holm adjusted P values, determined by a two-sided Mann–Whitney U-test with continuity correction, or no significance (NS, P > 5%). e. Increase in correlation of top correlated genes as early as day 3. For each timepoint (x axis), rank of selected genes’ (colored solid lines) correlation with the lineage size at Day 14 among all genes (y axis), normalized to lie between 0 and 1, and average relative correlation rank of genes with similar mean expression as determined by grouping genes by their mean log-normalized expression over all timepoints combined into 20 bins (colored dashed lines) (Methods).
