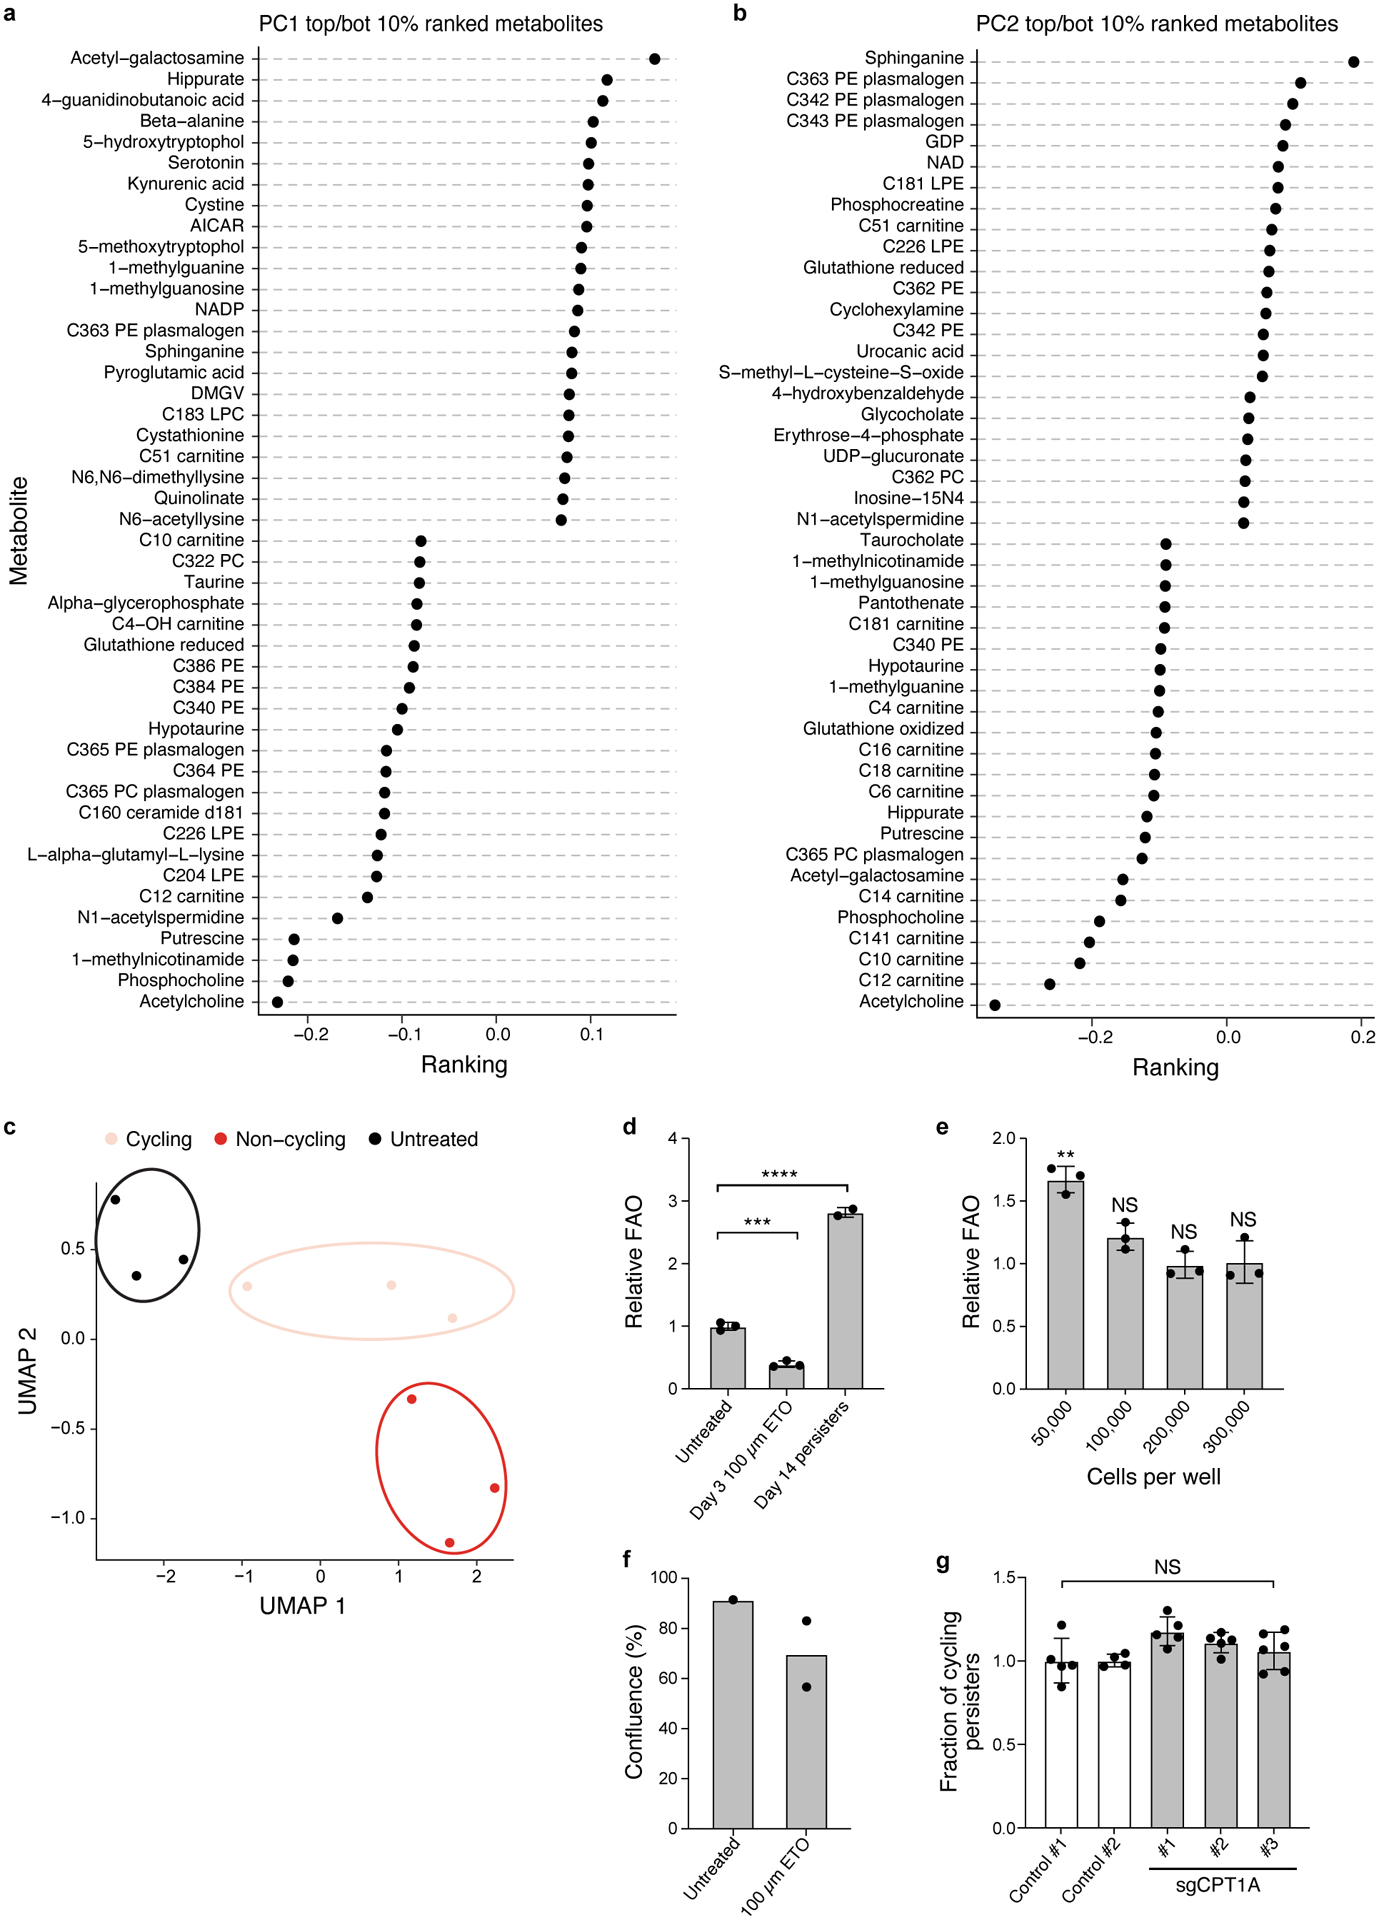
Extended Data Figure 7. Metabolite profiles of cycling persisters, non-cycling persisters and untreated parental cells and FAO measurements.

a,b. Principal Component Analysis (PCA) loadings (x axis) for the top 46 metabolites (y axis) associated with PC1 (a) and PC2 (b). c. UMAP representation of metabolomics data. d. Mean fatty acid oxidation (FAO) level (y axis, relative to mean of the untreated controls) measured by 3H-palmitic acid oxidation in PC9-Watermelon cells either untreated, treated only with 100 μM etomoxir for 3 days, or treated with 300nM osimertinib for 14 days. e. Mean FAO levels (y axis, relative to cells seeded at 300,000 per well, as used for the osimertinib time course) in PC9-Watermelon cells seeded at different densities (x axis) 24 hours prior to measurement. two tailed t-tests; **P < 0.01; NS – not significant (compared to 300,000 cells per well). f. Mean confluence (y axis) of PC9-Watermelon cells treated with 100μM Etomoxir for 14 days (Methods). g. Mean fraction of cycling persisters for control and sgCPT1A PC9 cells. Error bars are mean +/− SD of two (f) or three biologically independent experiments (d,e,g). **P < 0.01; ***P < 0.001; ****P < 0.0001; NS, not significant (P > 0.05); two-tailed t-tests (e-g).
