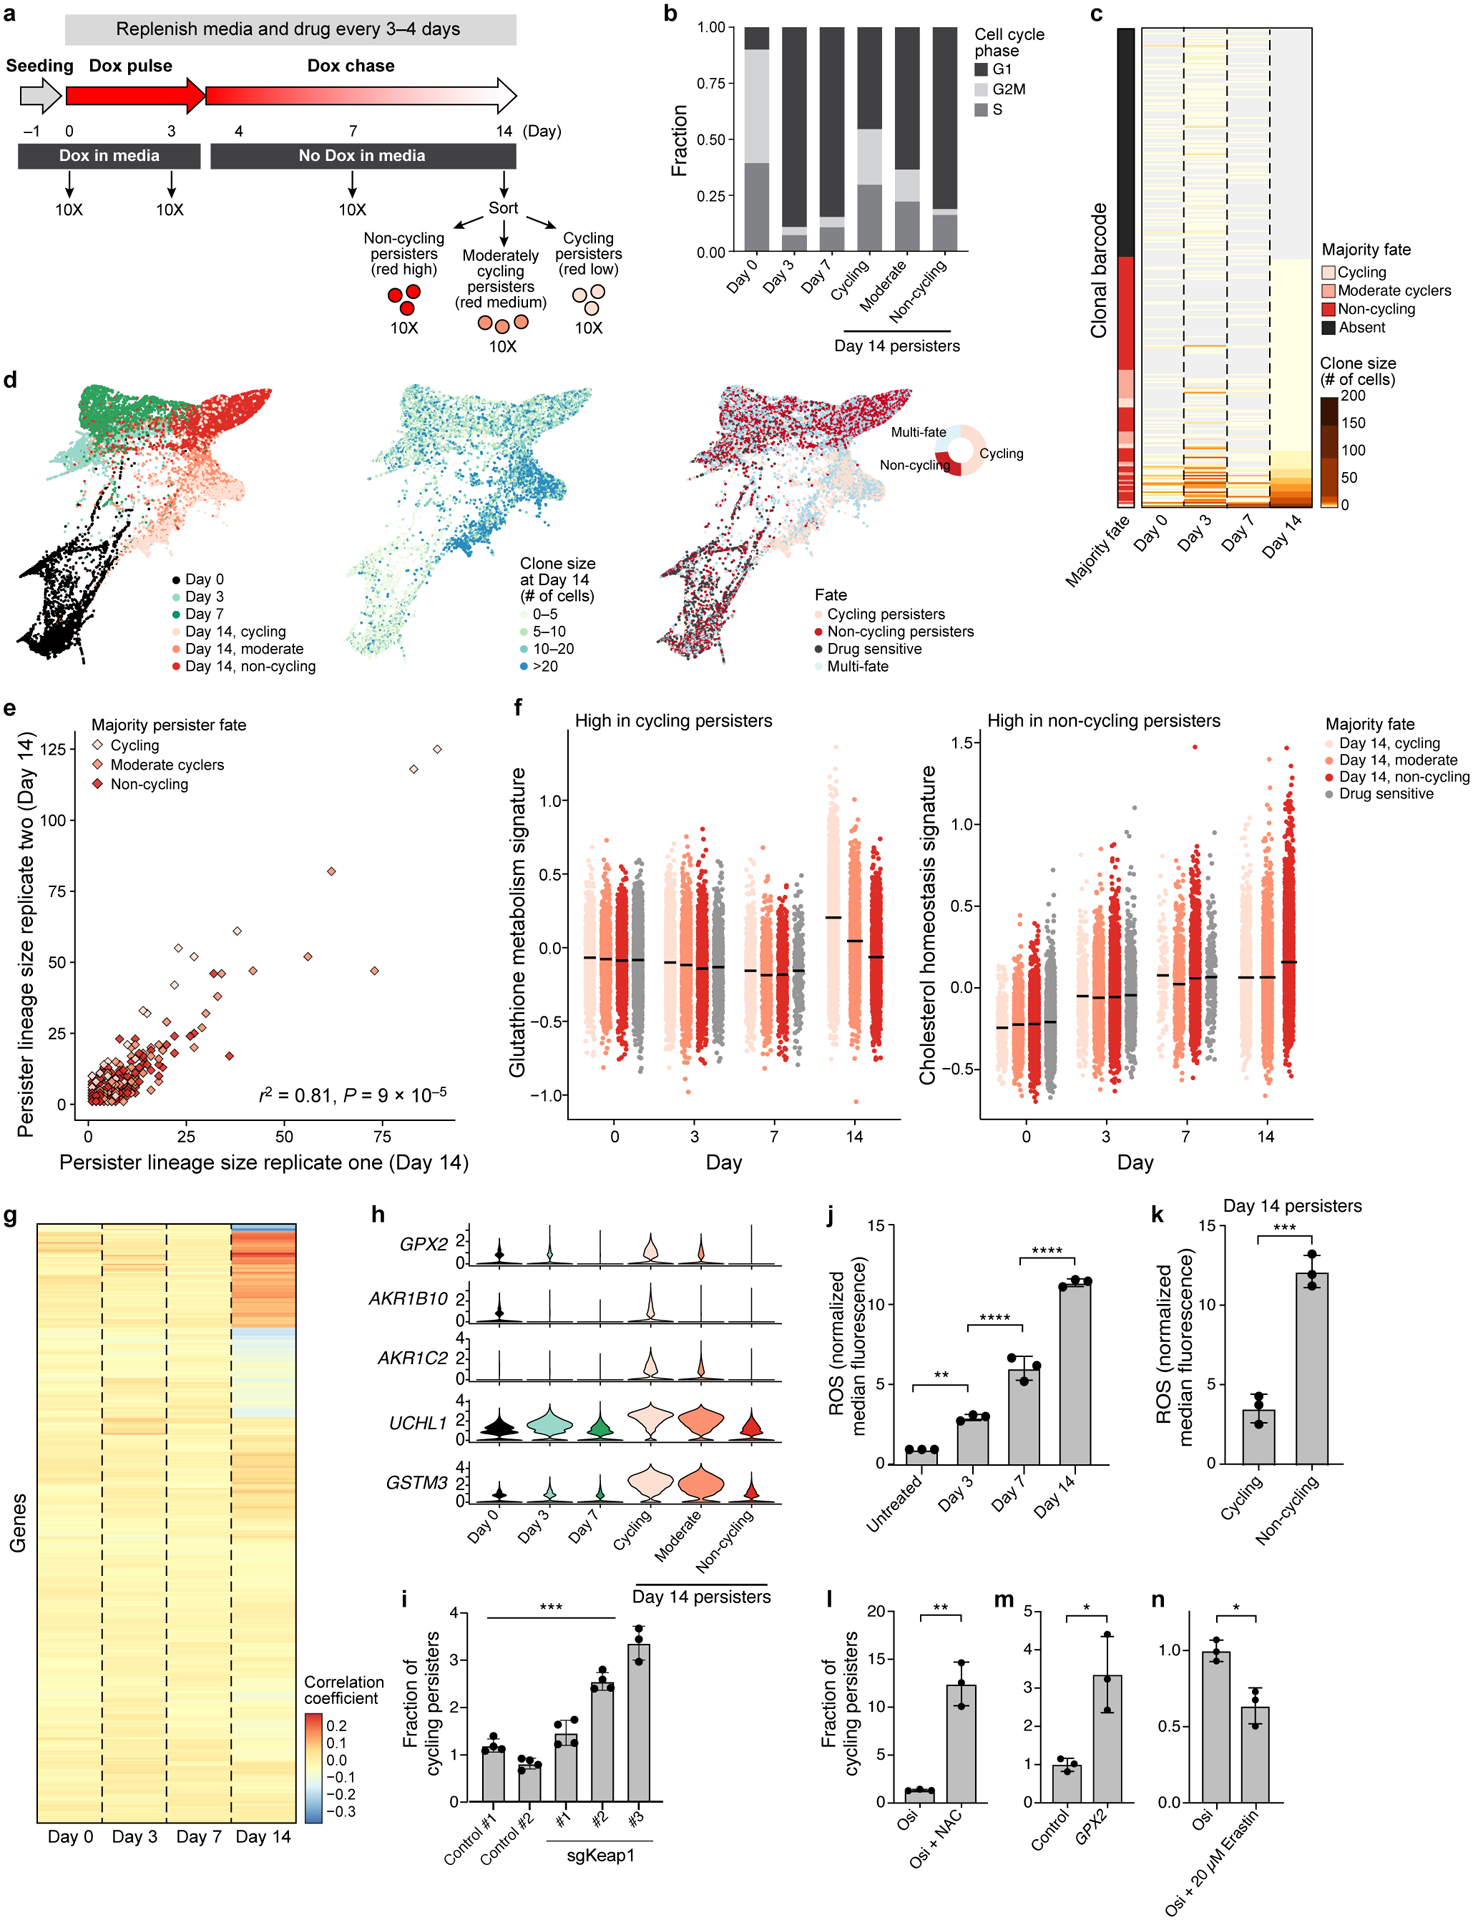
Figure 2. Cycling and non-cycling persisters arise from different cell lineages that express distinct transcriptional programs.

a. Experimental scheme. Vertical arrows: scRNA-seq collection time point. b. Proportion of cells in each cell cycle phase inferred from scRNA-seq. c. Lineage size (colourbar) for each lineage barcode (rows) across time points. Lineages sorted by fate at day 14, and marked by the majority fate of the mCherry populations on day 14 in that lineage (left bar). d. Force-directed layout of scRNA-seq profiles coloured by timepoint and day 14 mCherry expression (left); day 14 clone size (middle) or fate (right) of the lineage the cells belong to. Inset, right: fate distribution at day 14. e. Clone size of each persister lineage barcode in two independent experiments seeded from the same barcoded founding population. Colour: Persister fate of majority of cells in the lineage of combined replicates. P value determined by permutation test (Methods). f. Signature scores by lineage majority fate. g. Correlation coefficient (colourbar) of each gene’s (row) expression in each persister cell in a given timepoint (columns) and the cells’ corresponding lineage size at day 14. h. Distribution of expression levels (log2(TPM+1), y axis) across time for 5 of the top 10 genes positively correlated with persister lineage size. i. Fraction of cycling persisters following osimertinib treatment in control and sgKeap1 PC9 cells, P =3×10⁻⁴. j,k. ROS levels in PC9 treated with osimertinib timecourse (j, P0,3 =1.3×10⁻³, P3,7 < 1×10⁻⁴, P7,14 <1×10⁻⁴,one-way ANOVA with Tukey’s correction) or in persister subpopulations (k, P = 4×10⁻⁴). l-n. Fraction of cycling persisters following osimertinib treatment with or without NAC (l, P = 1.1 × 10⁻³), in PC9 transfected with control or a GPX2(m, P =1.5×10⁻²), or cells treated with or without Erastin (n, P =1×10⁻²). Error bars are mean +/− SD of three biologically independent experiments (i-n). * P < 0.05; ** P < 0.01; ***P < 0.001; two-tailed t-tests.
