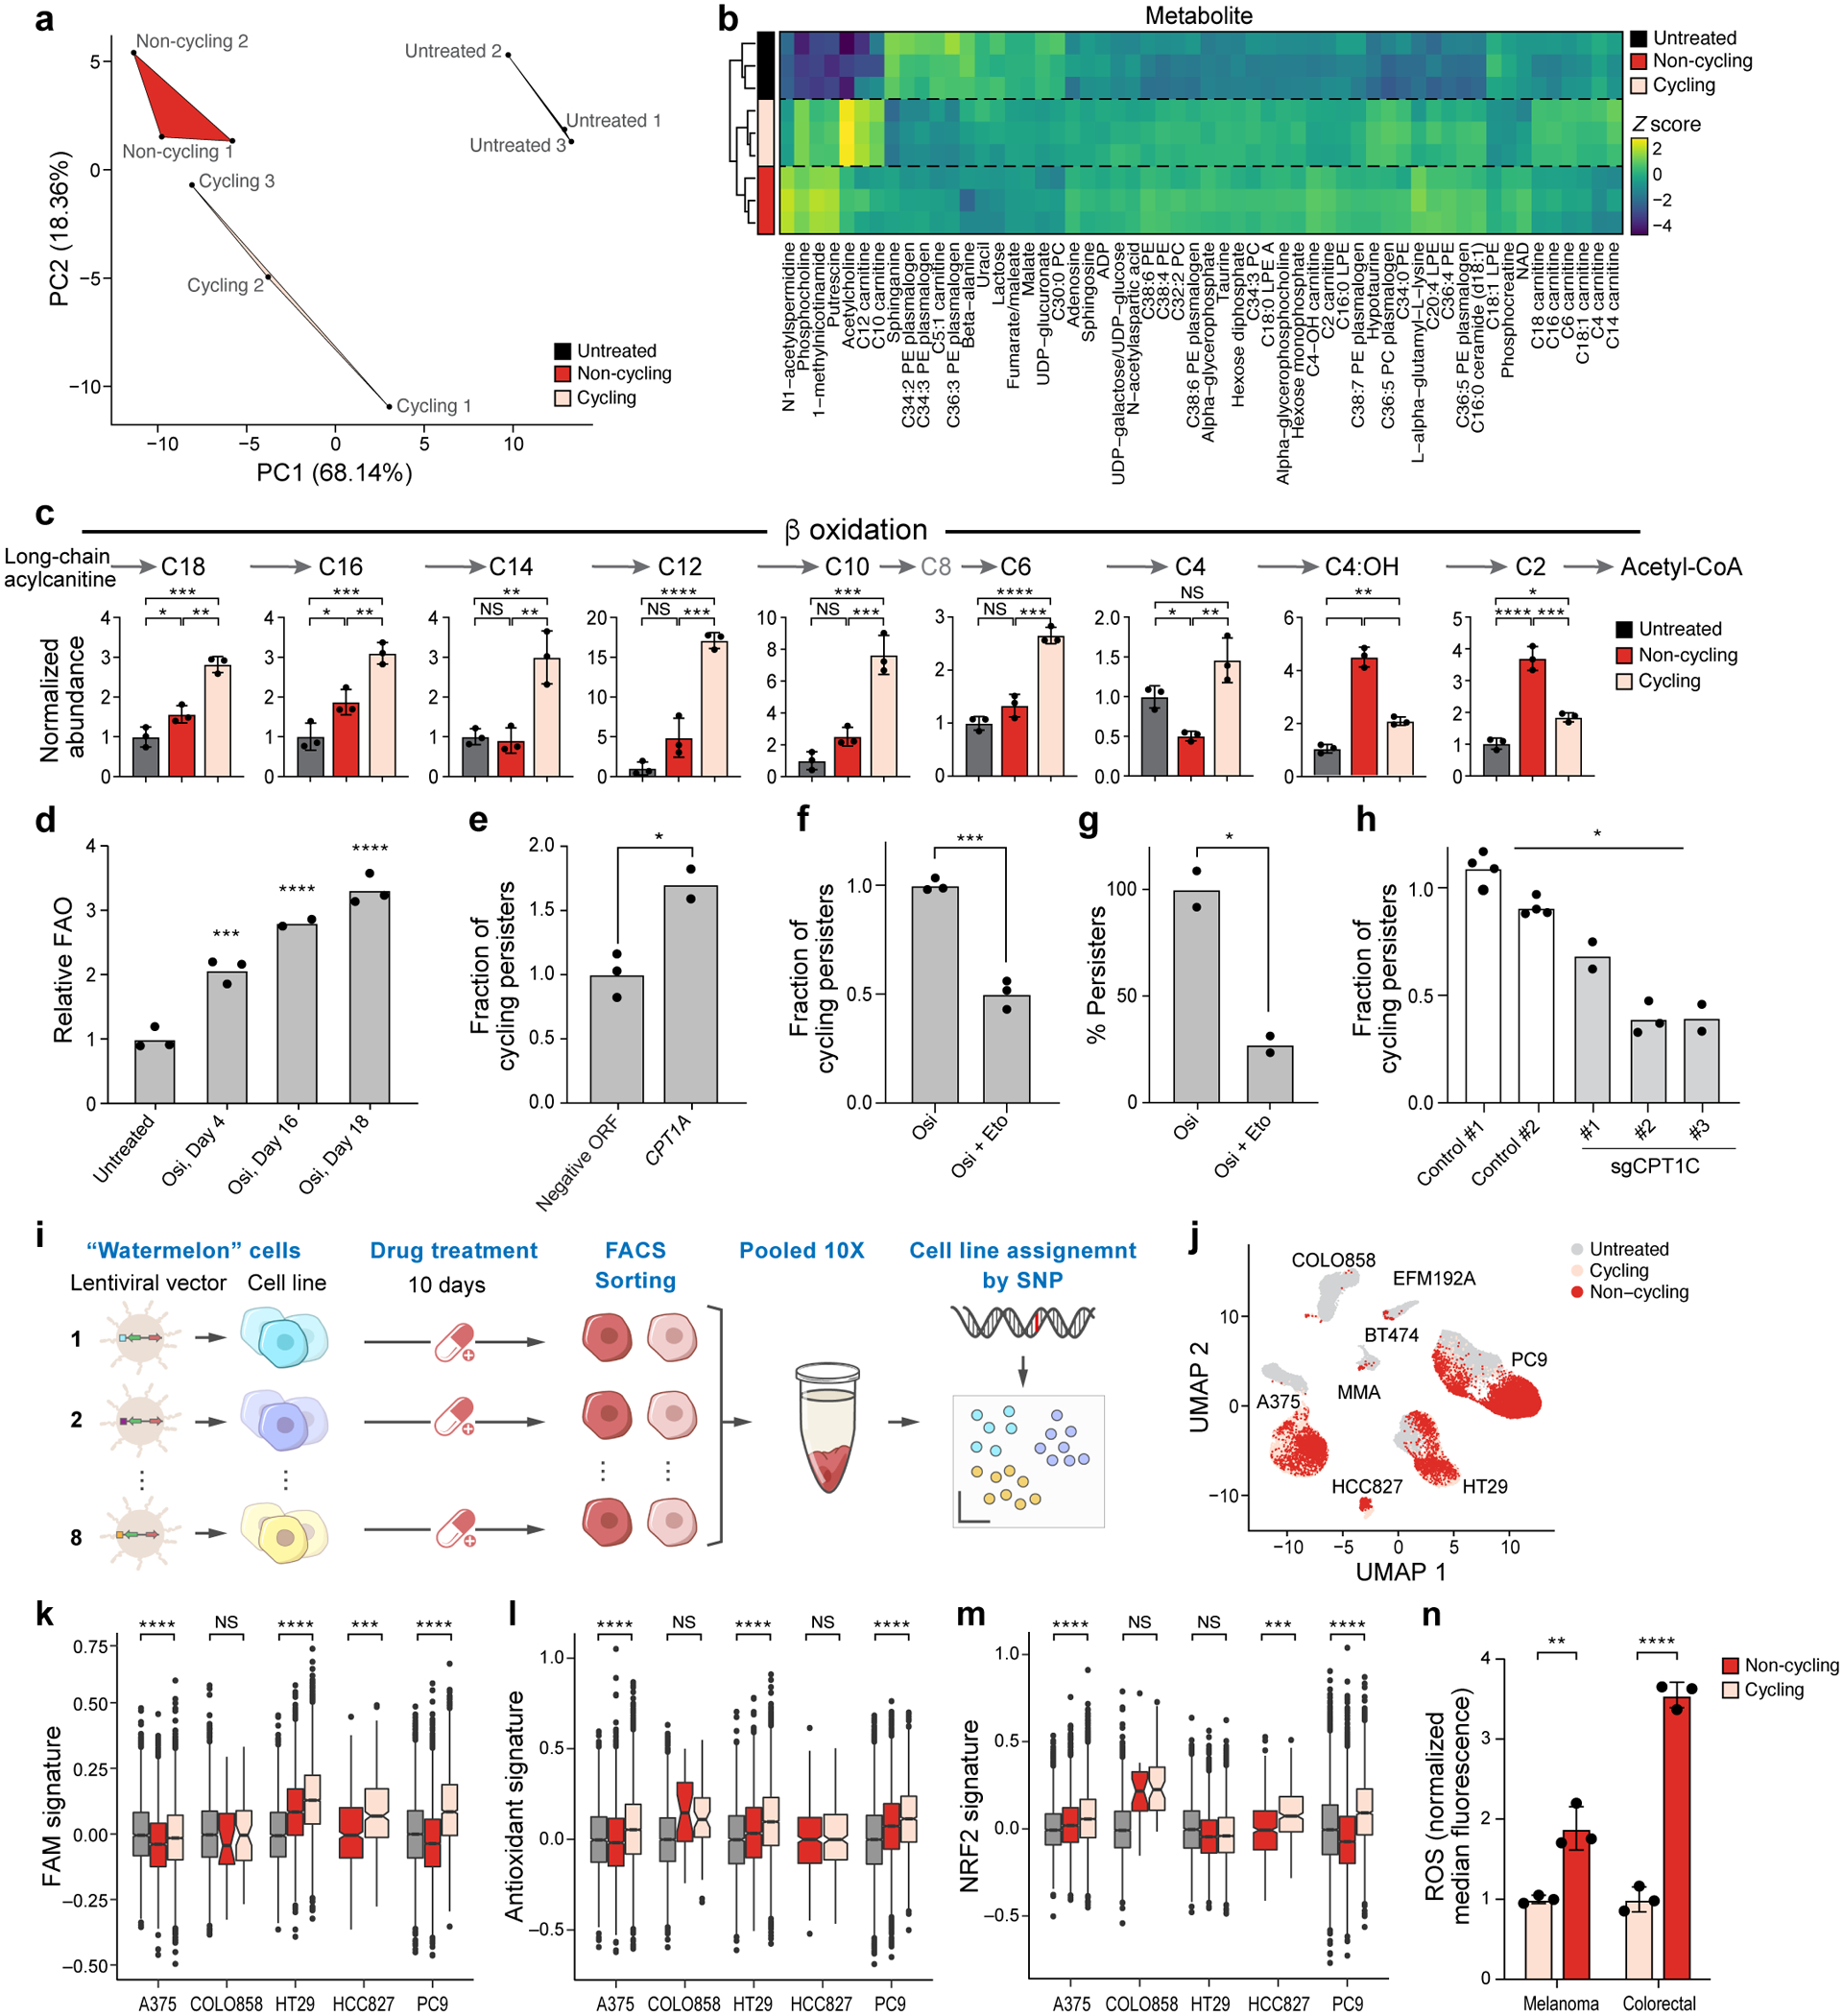
Figure 3. Persister cells shift their metabolism to fatty acid oxidation.

a. The first two principal components (PCs) of a Principal Component Analysis of LC-MS/MS metabolite profiles. b. Z-scores (colourbar) of differentially abundant metabolites (rows) (one-way ANOVA P-value<0.05) between cycling persisters (pink), non-cycling persisters (red) and untreated parental cells (black) (columns). c. Mean abundance of β-oxidation metabolites measured by LC-MS. d. Mean fatty acid oxidation (FAO) levels (y axis, relative to mean of untreated cells) measured by 3H-palmitic acid oxidation in PC9 osimertinib-treated cells over time. P0,4 = 8×10⁻⁴, P0,16 < 1×10⁻⁴, P0,18 <1×10⁻⁴, one-way ANOVA with Tukey’s correction. e. Mean fraction of cycling persisters at day 14 of 300 nM osimertinib treatment of PC9 transfected with control or CPT1A-expressing vector, P =1×10⁻². f,g. Mean fraction of cycling persisters (y axis, f, P =3×10⁻⁴) and overall fraction of persister cells (y axis, g, P =1.6×10⁻²) at day 14 of 300 nM osimertinib treatment alone or with 100μM Etomoxir at days 3–14. h. Mean fraction of cycling persisters for control and sgCPT1C PC9 cells, P = 3×10⁻². i. Schematic for pooled persister assay. j. UMAP of single cell profiles (dots) from eight Watermelon persister models coloured by cell cycle phase. k-m. Signature scores of fatty acid metabolism (k), antioxidant response (l) and NRF2 (m) pathways in persister cells from indicated models. Significance based on comparing cycling to non-cycling populations (Methods and Supplementary Table 2). Box plots represented by center line, median; box limits, upper and lower quartiles; whiskers extend at most 1.5× interquartile range past upper and lower quartiles. n. Mean ROS levels in melanoma (A375, P = 5.1×10⁻³) and colorectal (HT29, P <1×10⁻⁴) persister populations. Error bars are mean +/− SD of two (e,g) or three biologically independent experiments (c,d,f,h,n). * P < 0.05; * * P < 0.01; * * * P < 0.001; * * * *P < 0.0001; two-tailed t-tests.
