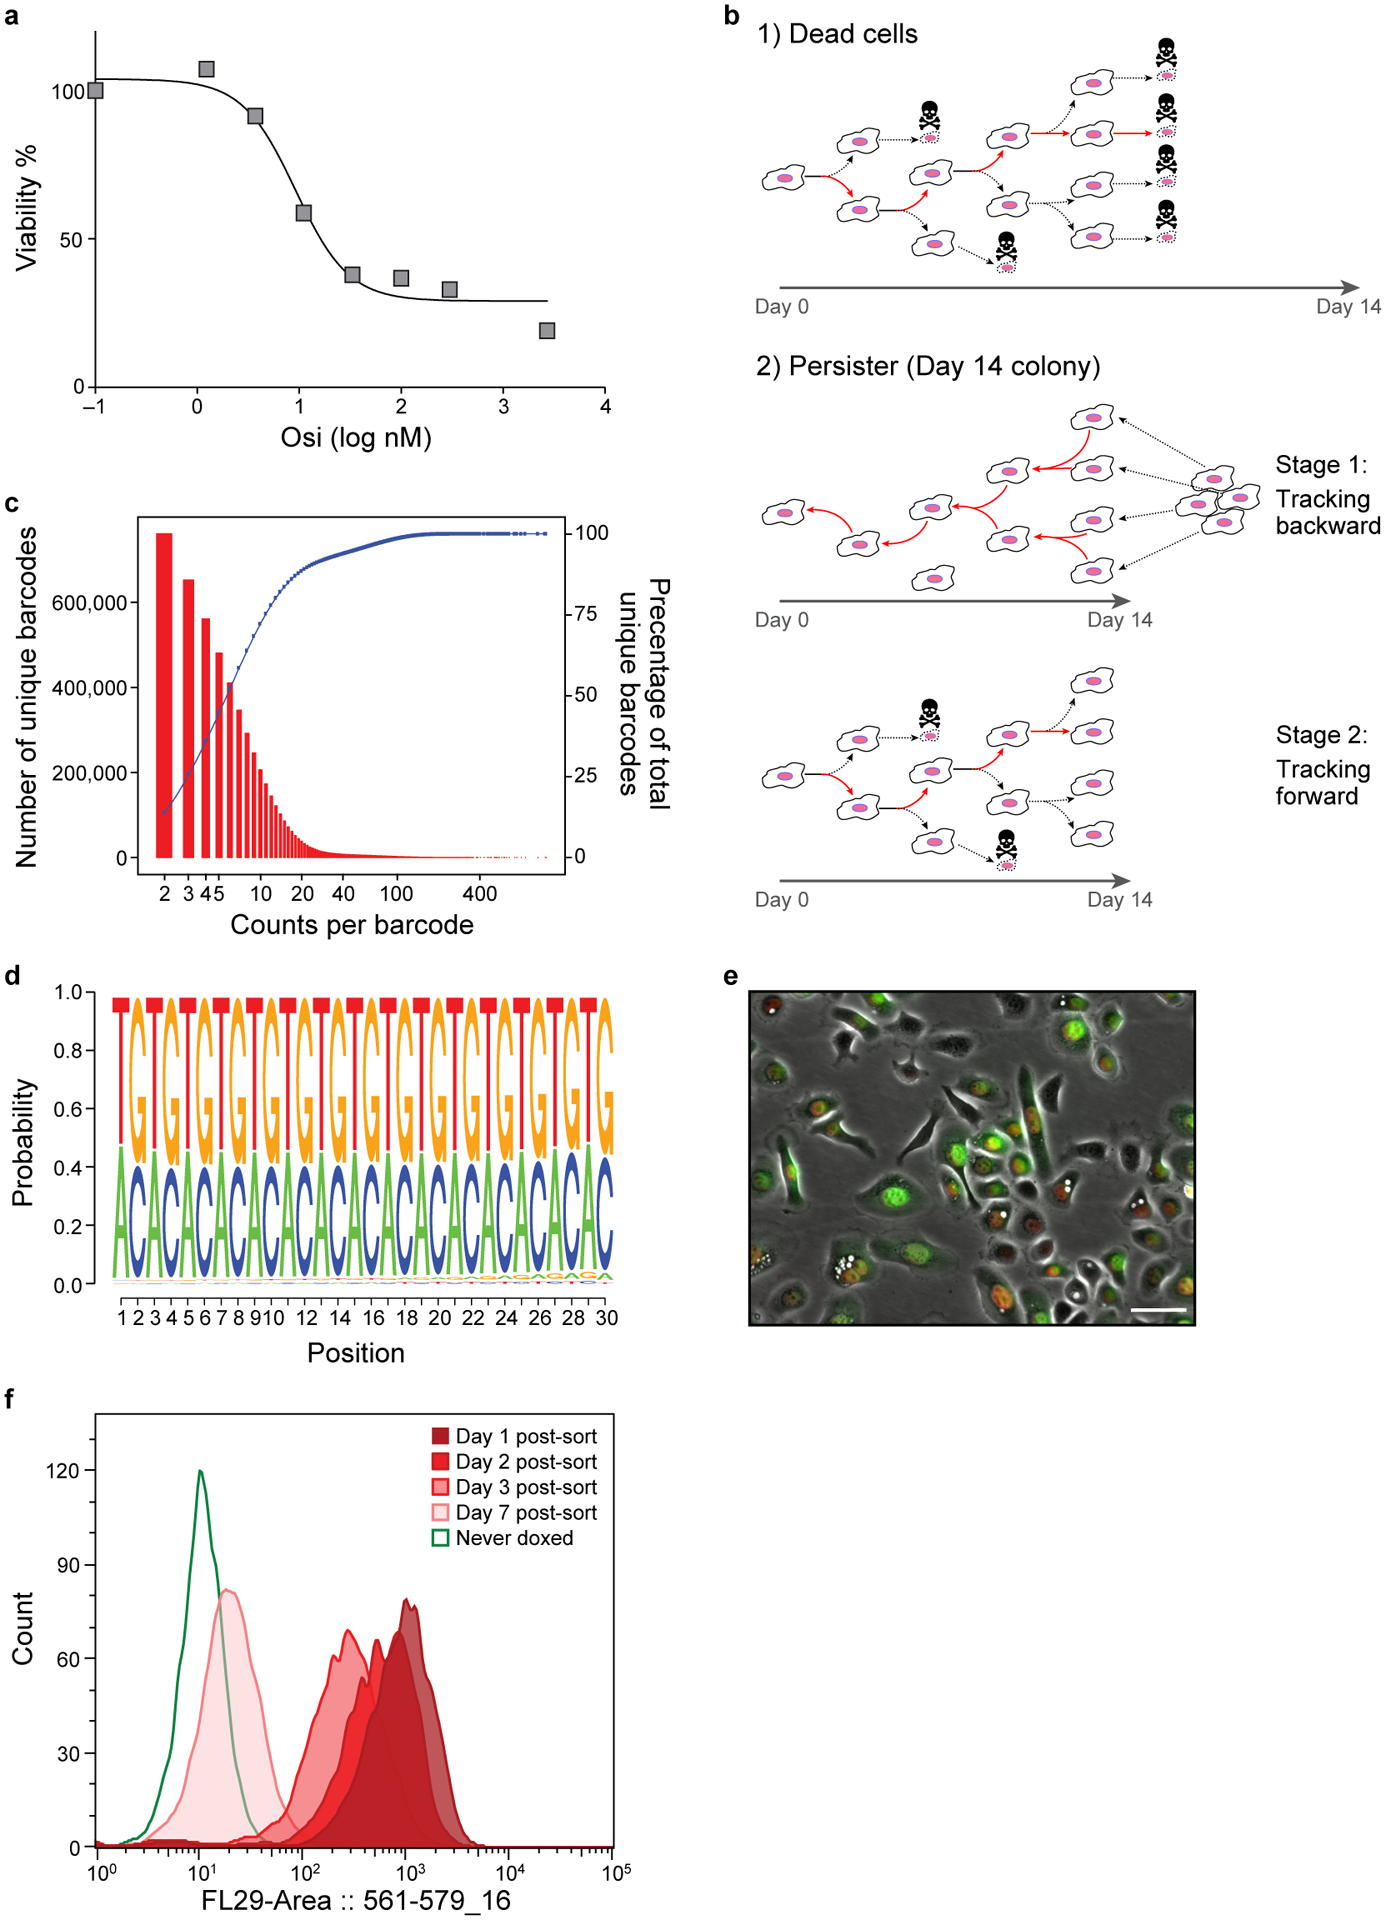
Extended Data Figure 1. Lineage detection efficacy and fluorescent dilution capacity of the Watermelon library.

a. Viability of PC9 cells treated osimertinib. % of viable PC9 cells (y axis) after 72hr of treatment with osimertinib at different concentrations (x axis). b. Schematic of tracking. (1). Tracking of non-persister cells. Red arrows: cell that was tracked in the lineage. (2). Tracking of persister cells. Colonies detected at day 14, and the time lapse is viewed and tracked from day 14 backward to day 0 to detect the common initiator cell. After the initiator cell is detected, this initiator is tracked forward as in a (red line indicates the tracked cell). c. Watermelon library complexity. Distribution of number of unique lineage barcodes (y axis, red bars) in a Watermelon plasmid library sequenced at a depth of ~68×106 reads. Blue curve: cumulative wealth distribution of unique barcodes. d. Watermelon library sequence diversity. Sequence logo of nucleotide composition at each position (x axis) relative to the beginning of the barcode sequence of 5,472,944 unique lineage barcodes detected in the Watermelon library. e. PC9-Watermelon cell line grown in dox containing media. A merge of the green, red and bright field channels is shown. Scale bar 20μm. f. Fluorescence dilution of H2B-mCherry over time reports proliferative history. Distributions of mCherry fluorescence level (x axis) for n=3000 cells analyzed by flow cytometry at each time point (color legend) from cells transduced with the Watermelon vector, exposed to dox for 48 hours, sorted for red positive cells and seeded in separate wells at t=0 (Methods). Data are representative of two independent experiments.
