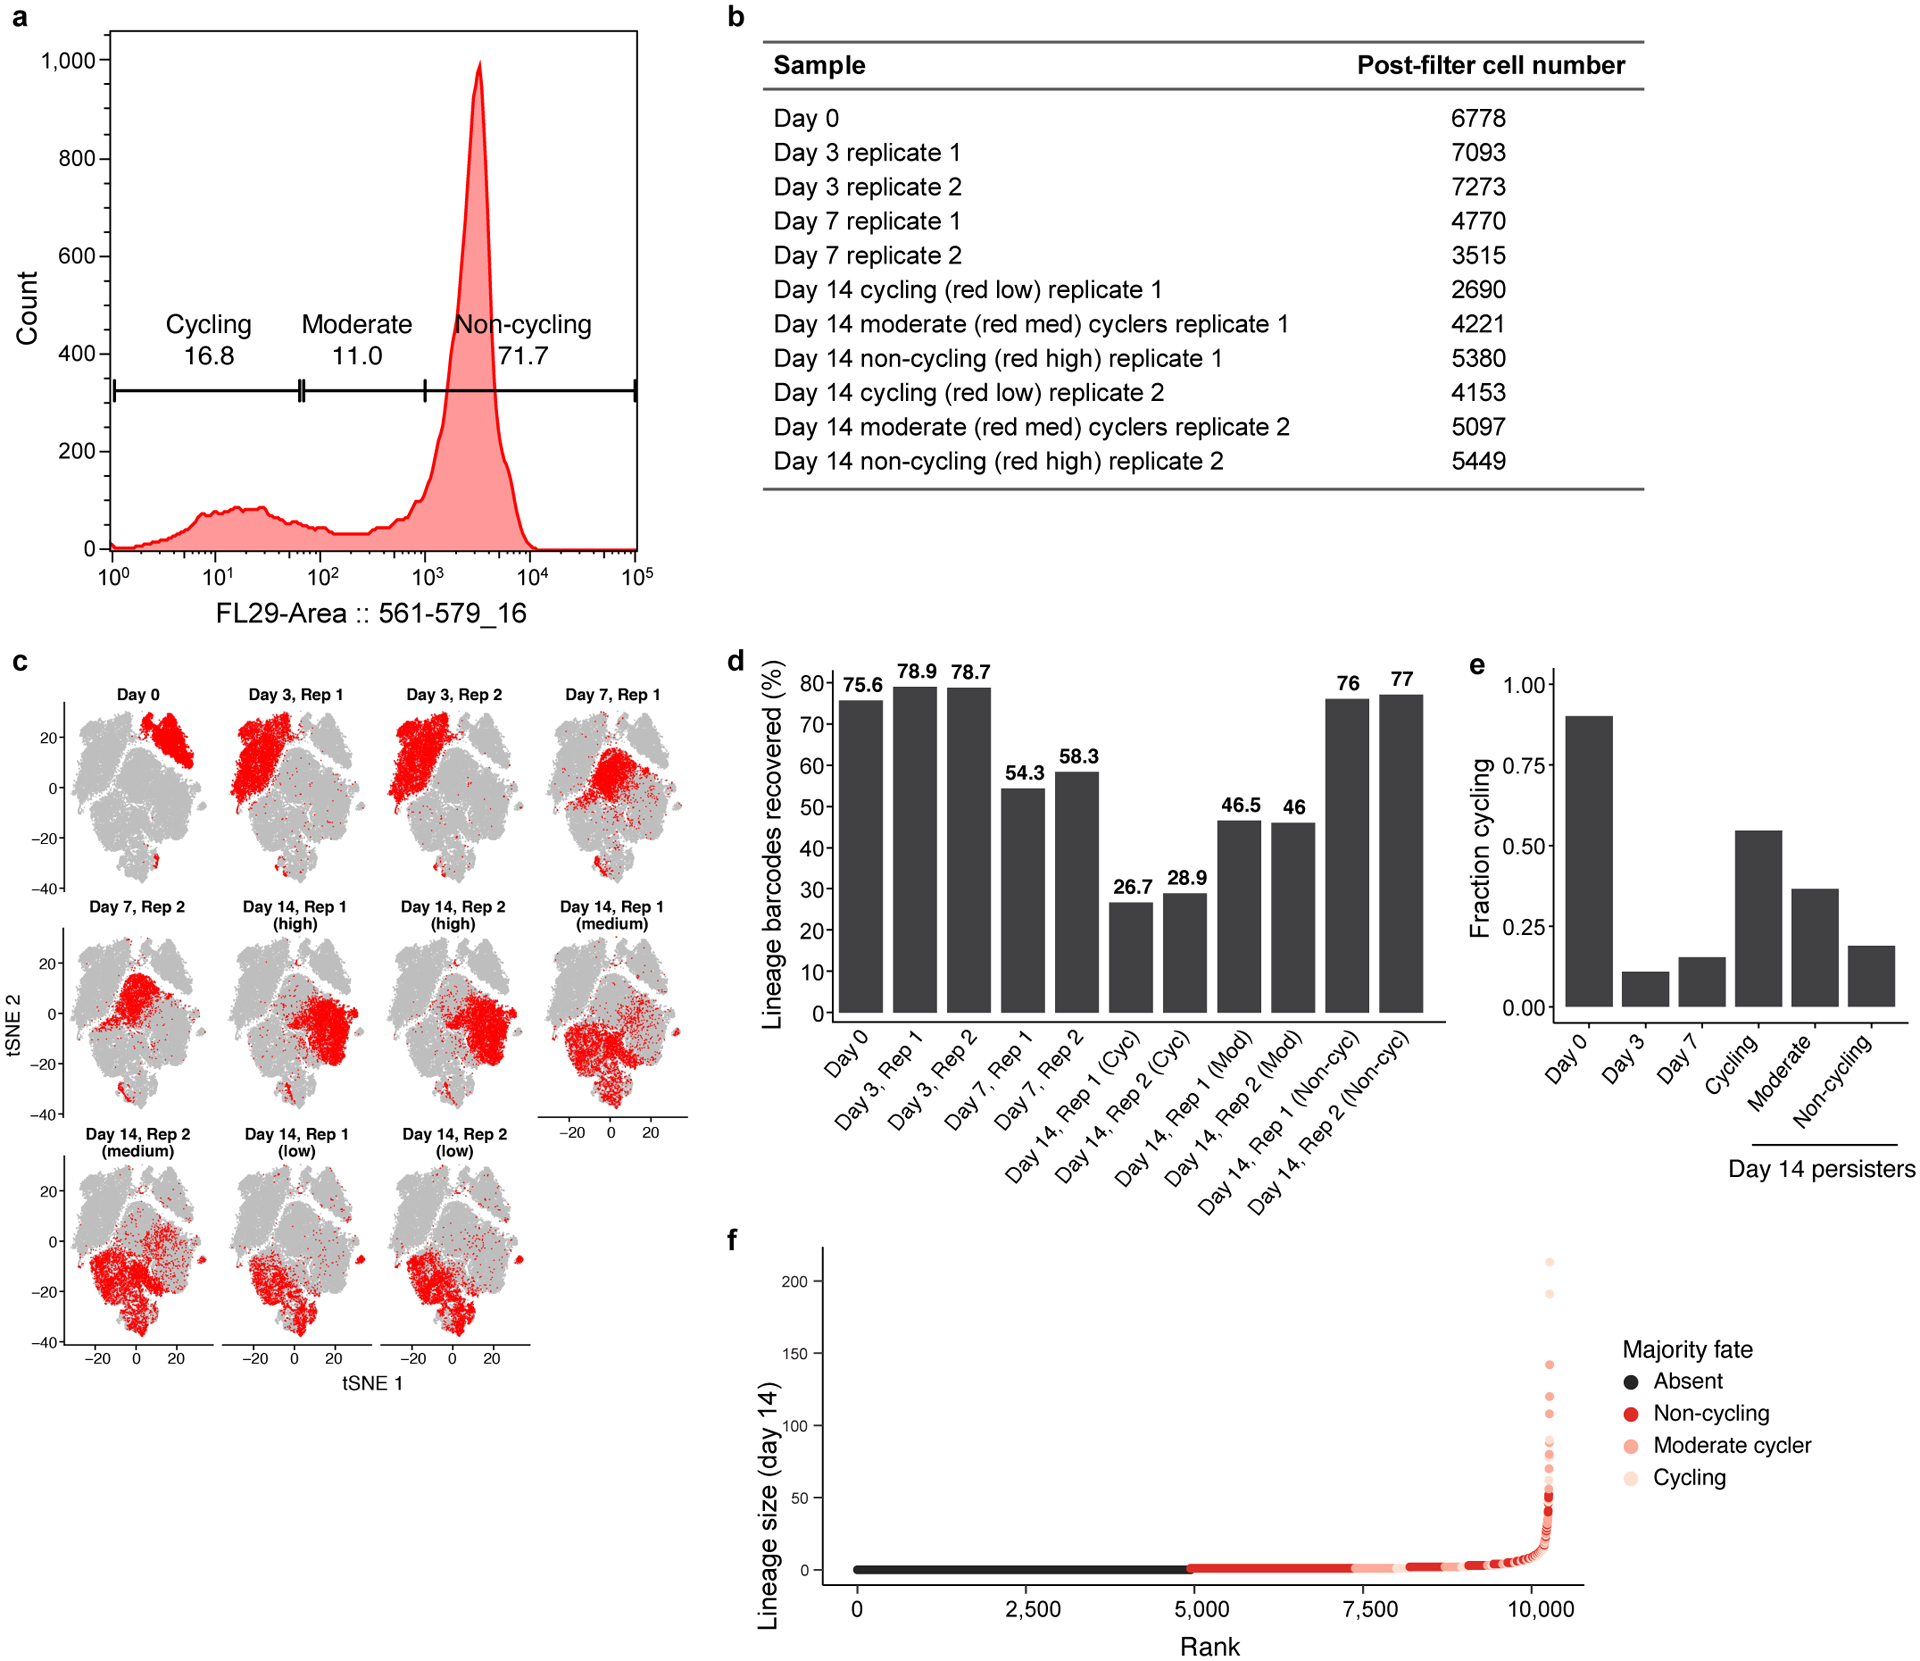
Extended Data Figure 2. scRNA-Seq along a time course of osimertinib treated PC9-Watermelon cells.

a. Sorting strategy. Distribution of mCherry fluorescence level (x axis) in Watermelon-PC9 cells gates at day 14 of osimertinib treatment, marked by representative sorting gates using to sort three persister subpopulations: cycling, moderate cyclers and non-cycling. b. Number of high-quality cells profiled in each sample. c. Changes in expression profiles following treatment. t-stochastic neighborhood embedding (tSNE) of 56,419 PC9-Watermelon cell profiles (dots), colored (red) by the labeled time point. d. Assignment of cells to lineages by lineage barcode. Percent of cells (y axis) at each time point/subpopulation (x axis) that have a detected lineage barcode. e. Identification of cycling cells. Percent of cells (y axis) at each time point/subpopulation (x axis) that express either the G2/M or S phase signature. f. Majority fate. Clone size on day 14 (y axis) of each persister lineage barcode inferred from scRNA-seq ordered by ascending rank order (x axis) and colored by majority fate based on flow sample provenance of the captured cells.
