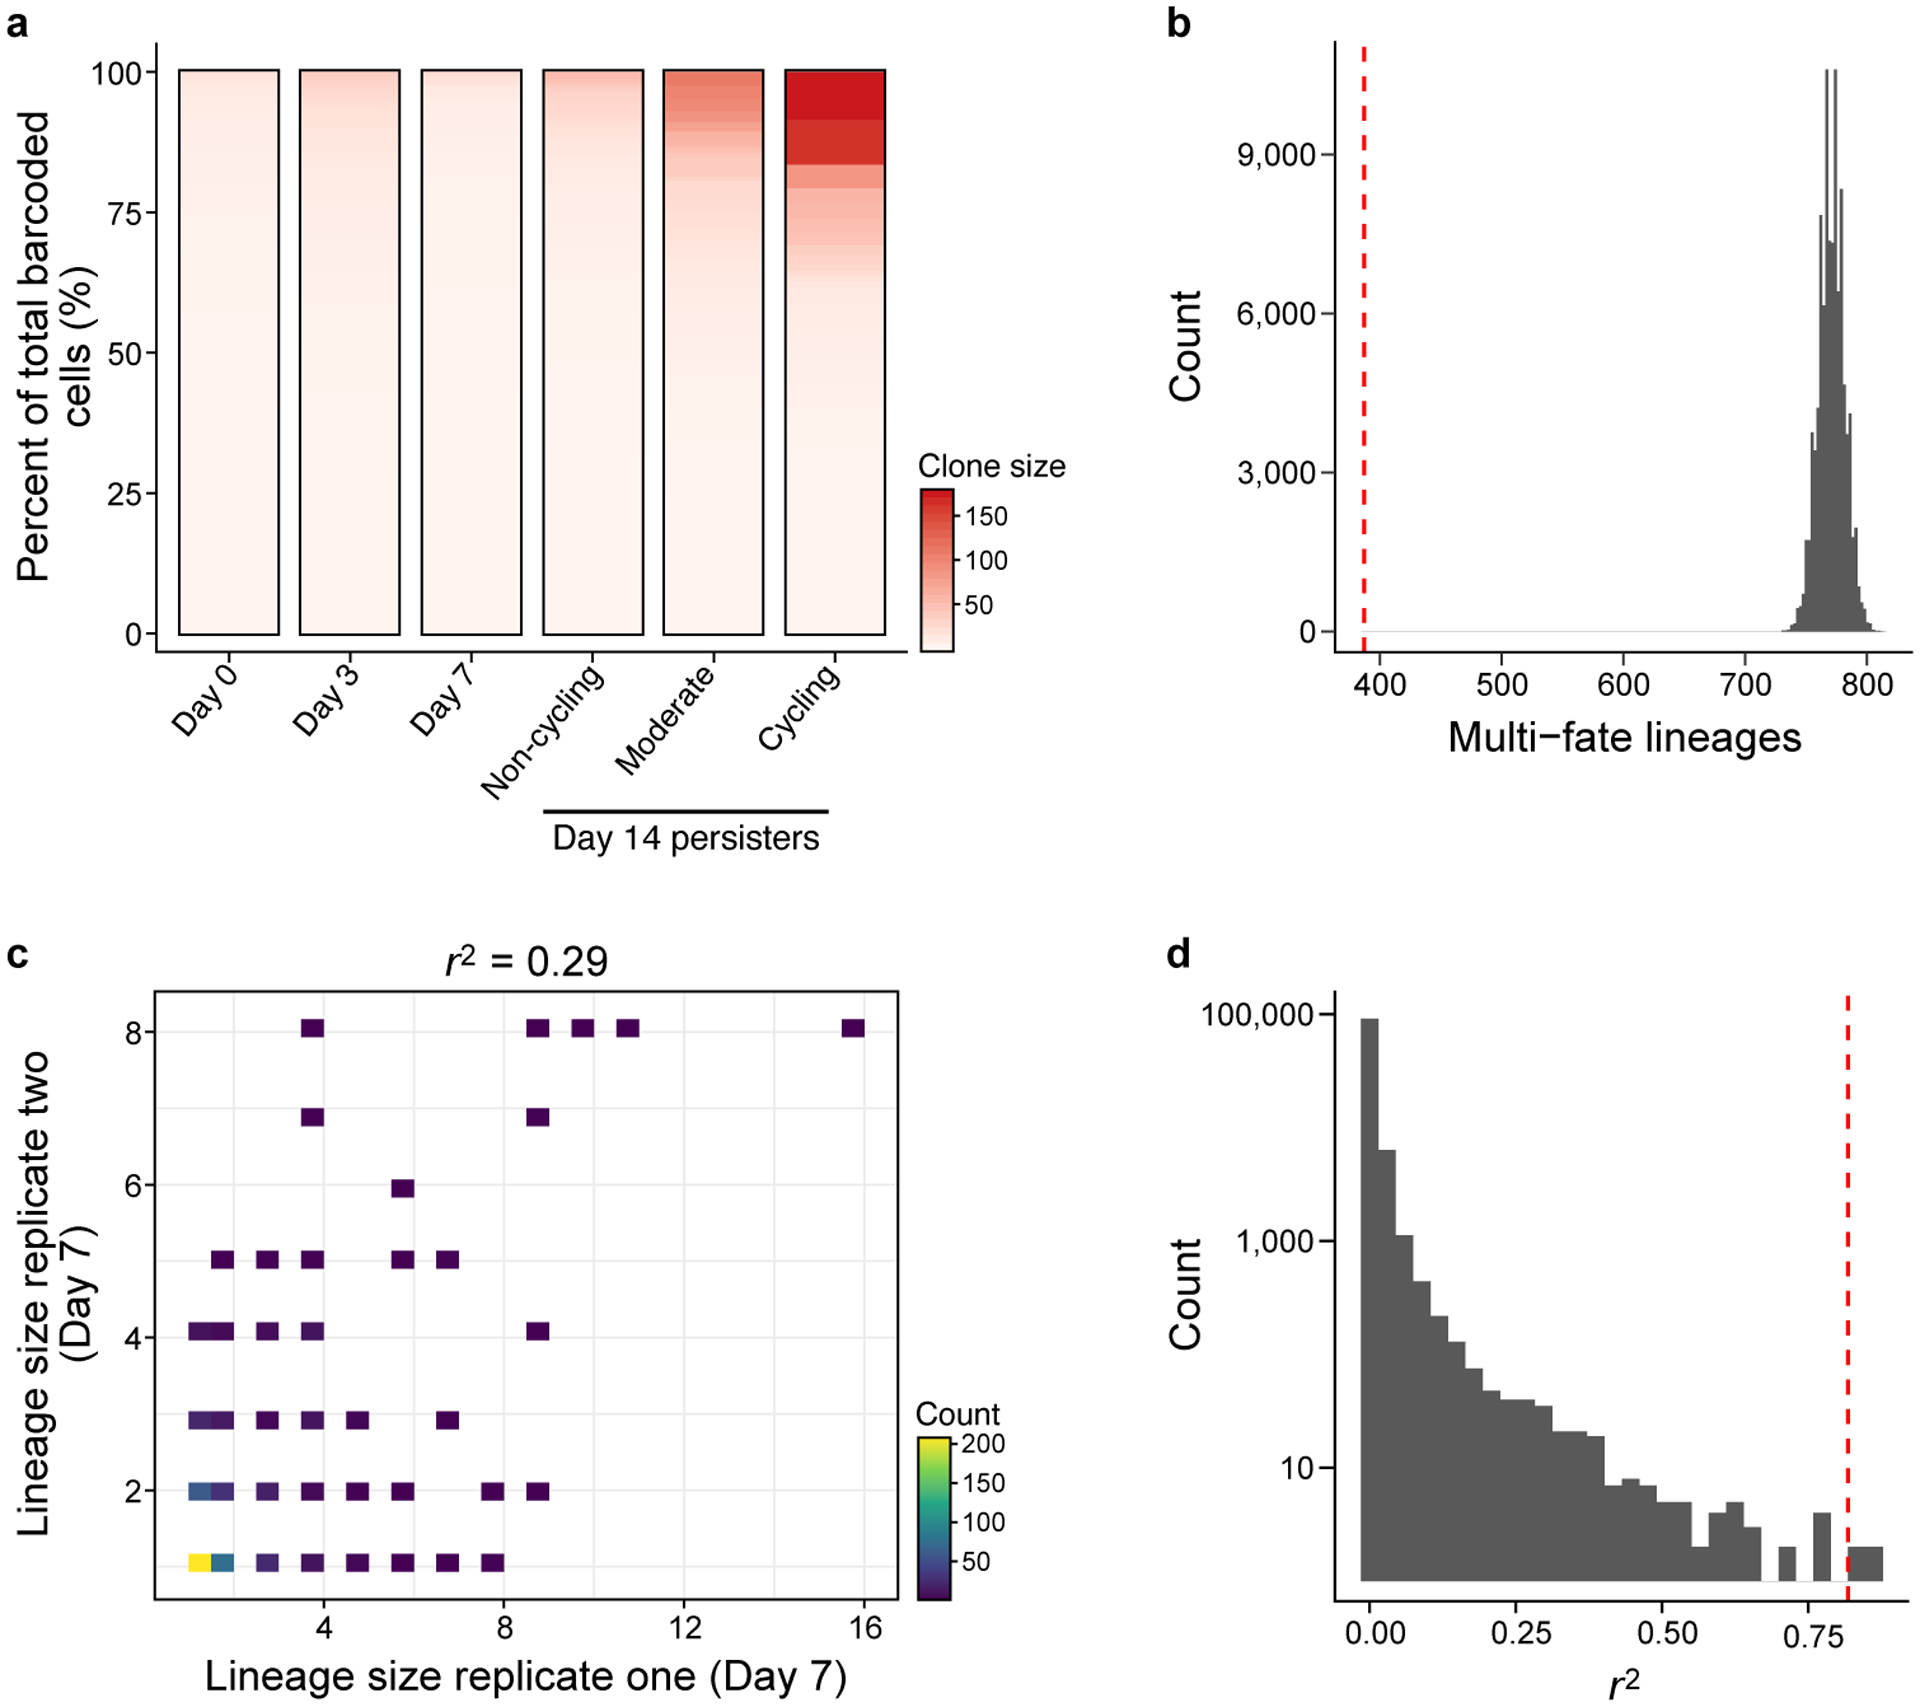
Extended Data Figure 4. Lineage fate analysis.

a. Single cell-derived clone size by sample. In each sample, detected barcodes were sorted in descending order by the sum of their counts. Each unique lineage barcode was accounted as a separate clone. b. The number of observed multi-fate lineages is significantly smaller (P = 1×10⁻⁵) than expected by chance. Distribution of the number of multi-fate lineages (x axis) in simulated data. Red line: observed number of multi-fate lineages. c,d. Clone size reproducibility is significantly higher than expected by chance. c. Clone size on day 7 of each persister lineage barcode inferred from scRNA-seq (x, y axes) in each of two independent experiments seeded from the same barcoded founding cell population. Top: linear correlation coefficient. d. Distribution of r2 values (x axis) in simulated day 14 data. Red line: observed r2 between the two replicates at day 14.
