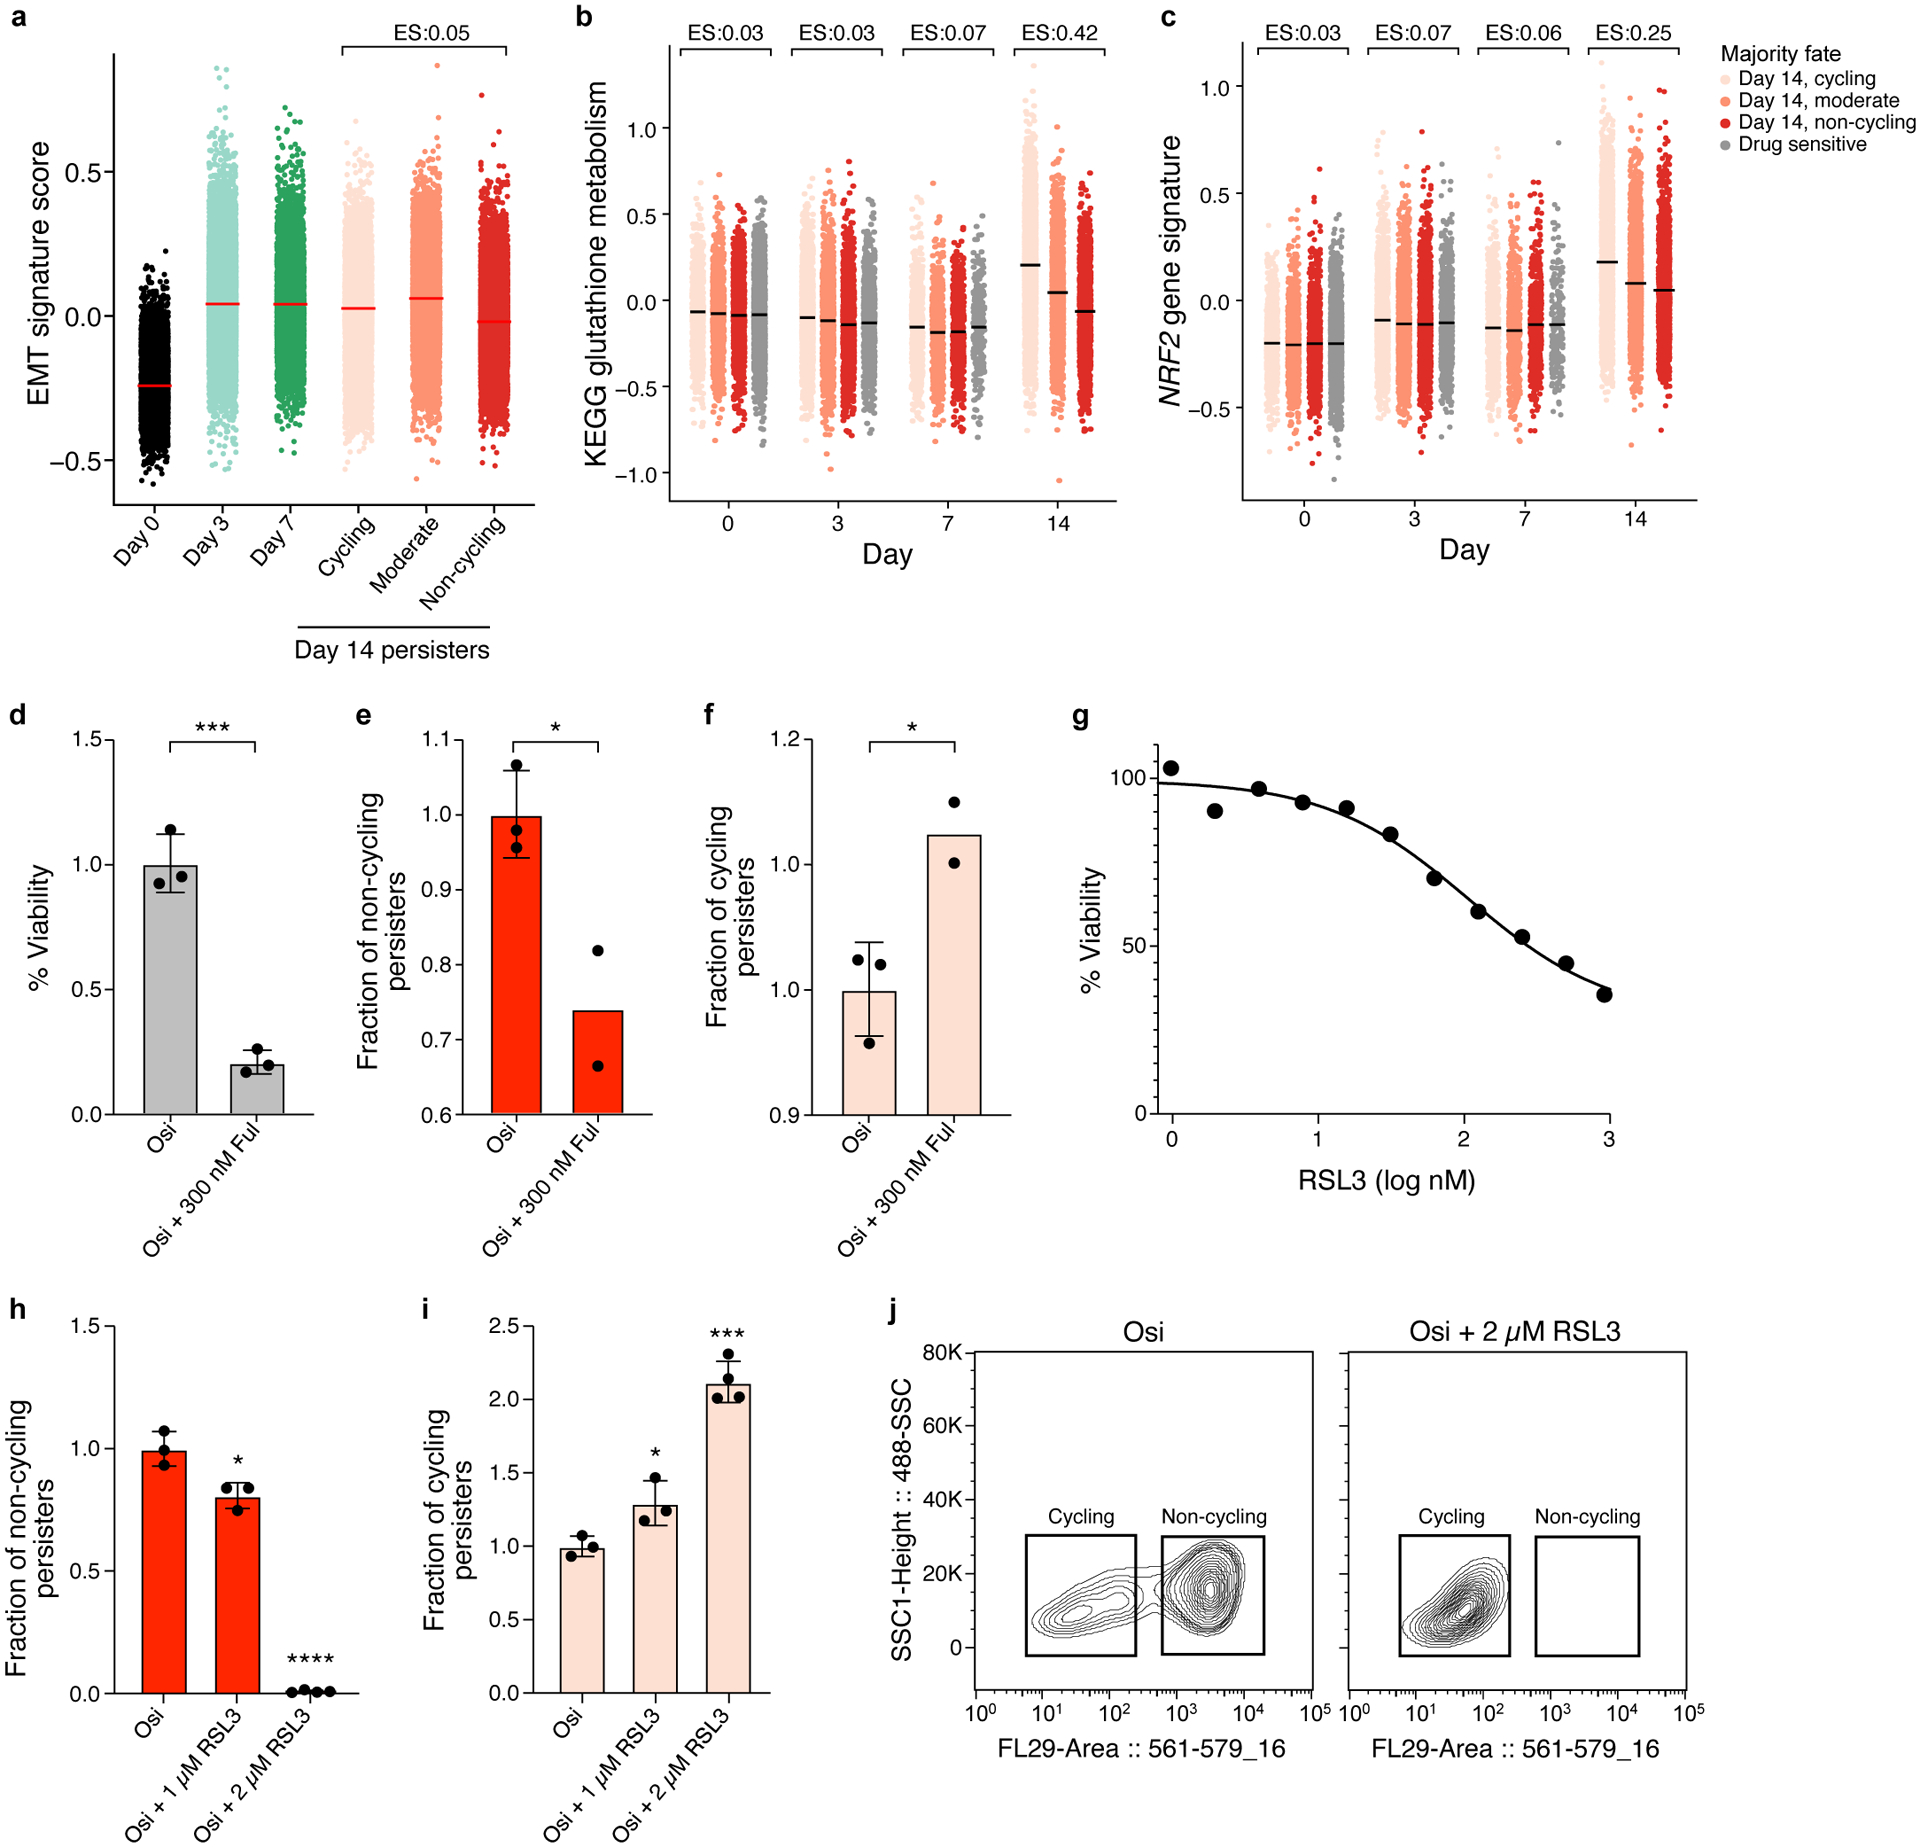
Extended Data Figure 5. Differences in transcriptional programs and drug response in cycling and non-cycling persisters.

a. EMT signature expression are similar in cycling and non-cycling persisters. Distribution of expression levels of EMT (y axis, log2(TPM+1)) across time points and subpopulations. Effect size (ES, b): difference between the mean signature score of cycling and non-cycling persisters. b-d. Persister populations show differential sensitivity to fulvestrant. Effect of fulvestrant co-treatment (300nM fulvestrant during days 14–20 of 300nM osimertinib) on overall survival (b) non-cycling (c) and cycling cells (d). e-g. Persister populations show differential sensitivity to RSL3. Effect of different doses of RSL3 co-treatment (during days 3–14 of 300nM osimertinib) on overall survival (e) non-cycling (f) and cycling cells (g). h. Co-treatment with 2 μM of RSL3 shifts surviving persister cells to cycling. Distributions of mCherry fluorescence level (x axis) for cells analyzed by flow cytometry with and without RSL3 co-treatment (panel legend). i,j. Higher expression of glutathione metabolism and NRF2 signatures in cycling vs. non-cycling persisters. Signature score (y axis) of glutathione metabolism (i) and NRF2 pathway (j) signatures in cells profiled at each time point (x axis) stratified by their lineage majority fate at day 14 (color legend). Effect size (ES) indicates difference between the mean signature score of cycling and non-cycling persisters. Error bars are mean +/− SD of two (e,f) or three biologically independent experiments (d,h-i). *P < 0.05; **P < 0.01; ***P < 0.001; ****P < 0.0001; two-tailed t-tests compared to osimertinib only condition (d-f, h-i).
