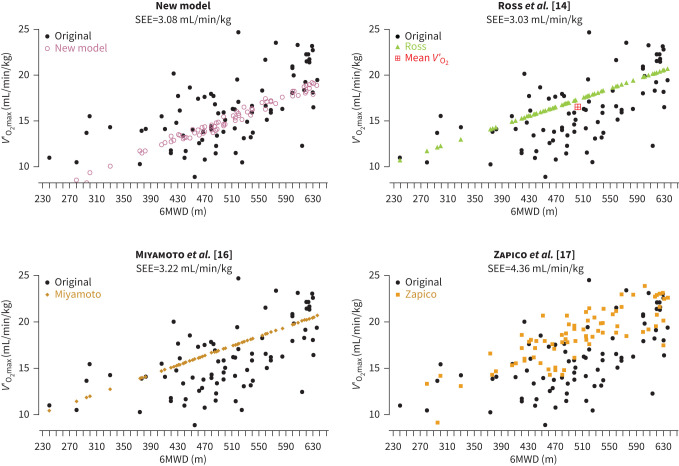
FIGURE 3.
Comparison of predictive models. The panels show the predicted values for maximal oxygen uptake (VO2max) against 6-min walk distance (6MWD) for each model separately. In each panel, the original data from the testing dataset is depicted for comparison; standard error of the estimate (SEE) for each model is shown below the panel headers. Mean oxygen uptake (V′O2) as determined by the generalised equation by Ross et al. [14] is shown in the corresponding panel.

