FIGURE 2.

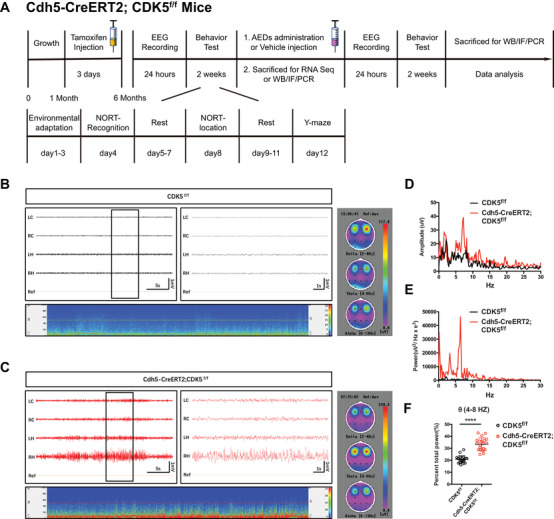
Endothelial CDK5 deficits caused seizure in mice. (A) The schematic diagram of experimental process. (B and C) Representative EEG recording spectrogram of CDK5f/f (B) and Cdh5‐CreERT2;CDK5f/f (C) (LC: left cortex, RC: right cortex, LH: left hippocampus, RH: right hippocampus), oscillation subtypes were distinguished and analyzed, respectively, according to frequency: δ (0–4 Hz), θ (4–8 Hz), and α (8–13 Hz). (D and E) Amplitude (μV) and power (μV2/Hz × e3) curve were analyzed using Labchart 8 software. (F) Quantitative analysis of single subtype: θ (4–8 Hz)/total power ratio. ****p < 0.0001, Student's t‐test. Both error bars indicate the mean value ± SEM
