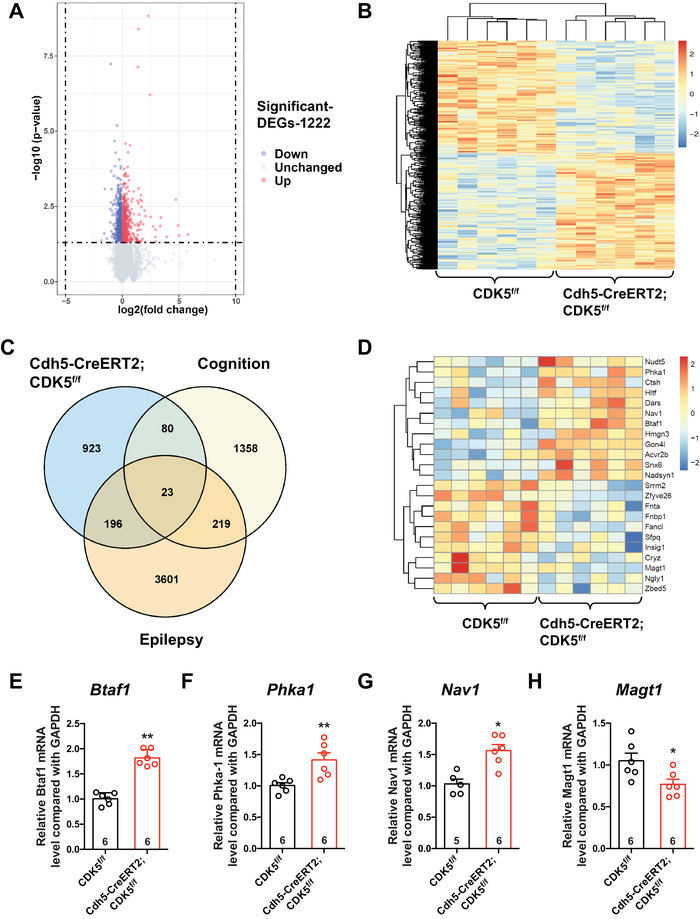
FIGURE 4.

Changes of gene expression in the hippocampus of endothelial CDK5‐deficit mice. (A) Volcano plot of genes expression profiler. (B) Heatmap of 1222 differentially expressed genes. (C) Venn plot representing the number of intersecting genes. (D) Heatmap of 23 intersecting genes. (E–H) The relative mRNA level of indicated genes (Btaf1, Phka1, Nav1, Magt1) in hippocampus of CDK5f/f and Cdh5‐CreERT2;CDK5f/f mice
