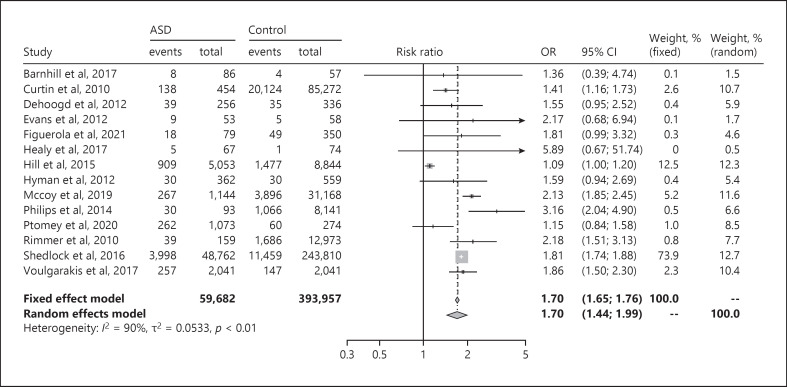
Fig. 2.
Forest plot of OR between children with ASD and obesity and control children with obesity. ASD, autism spectrum disorder; OR, odds ratio; CI, confidence interval. The two left-hand columns (“events” and “total”) correspond to the ASD group, and the next two columns (“events” and “total”) represent the control group.

