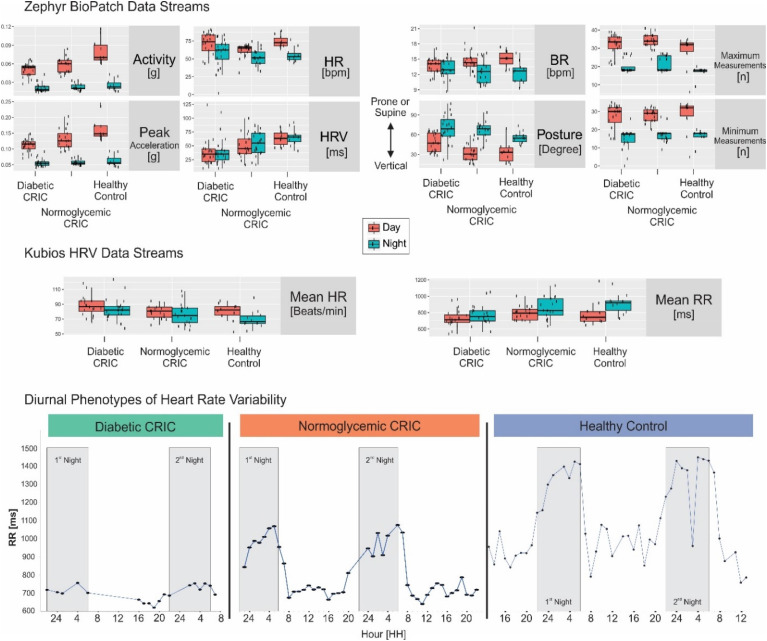
Figure 1.
Diurnal phenotypes on cohort and patient level. Top: Boxplots of BioPatch data streams are stratified by cohort diabetic (left) and normoglycemic (center) patient with CKD compared to healthy controls (right) as well as by day (orange) and night (green) for the following readouts: Activity (g), peak acceleration (g), heart rate (HR, bpm), SDNN (standard deviation of normal-to-normal RR intervals is calculated as rolling heart rate variability (HRV) value in ms), breathing rate (BR, bpm), and posture (degree where values toward 0 indicate vertical posture and negative values indicate prone or supine torso positions). Center: Boxplots of EKG waveform data streams are analyzed by Kubios. HR (bpm) and interbeat intervals (RR, ms) are stratified by cohort as well as day and night. Bottom: Time-of-day dependent modulation, or absence thereof, of interbeat intervals (RR, ms) at participant level for a diabetic (left) and normoglycemic (center) patient with CKD compared to healthy control (right). Gray rectangular indicates the first and second night (22:00–06:00). CKD, chronic kidney disease.

