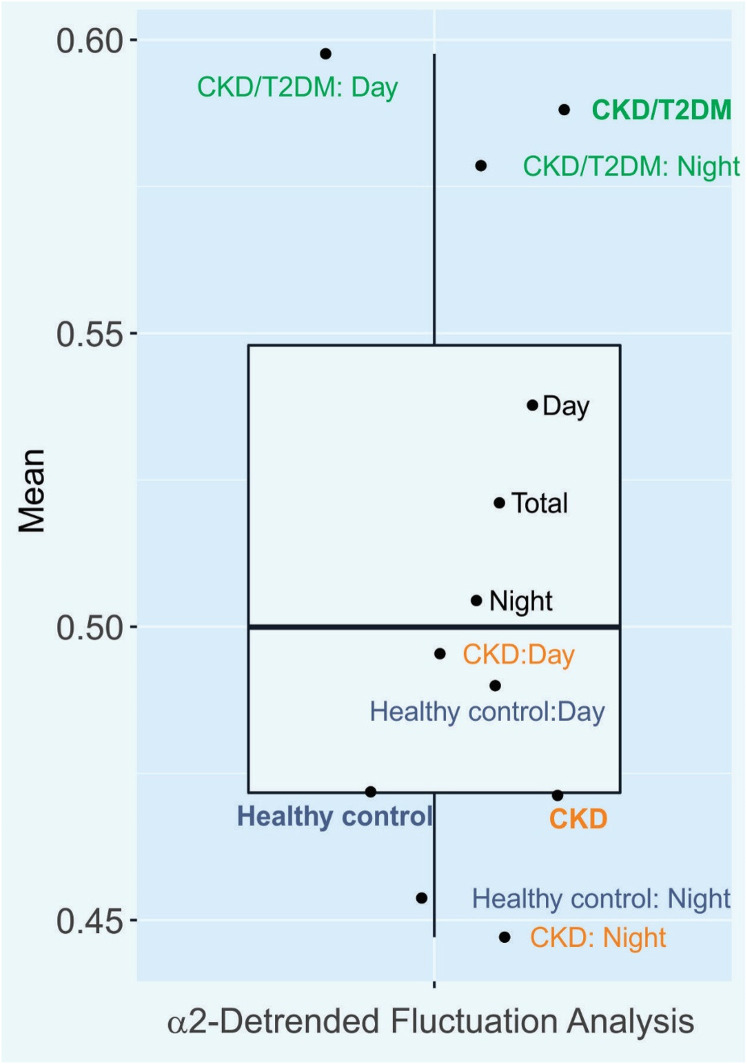
Figure 2.
α2 long-term fluctuations in detrended fluctuation analysis (α2-DFA). Boxplot with mean values for the Kubios heart rate variability (HRV) readout, α2-DFA, are shown for all participants (black dots) as well as for CKD/T2DM patients (green dots), CKD patients (orange dots), and healthy volunteers (blue dots) including day versus night differences. CKD, chronic kidney disease; T2DM, type 2 diabetes mellitus.

