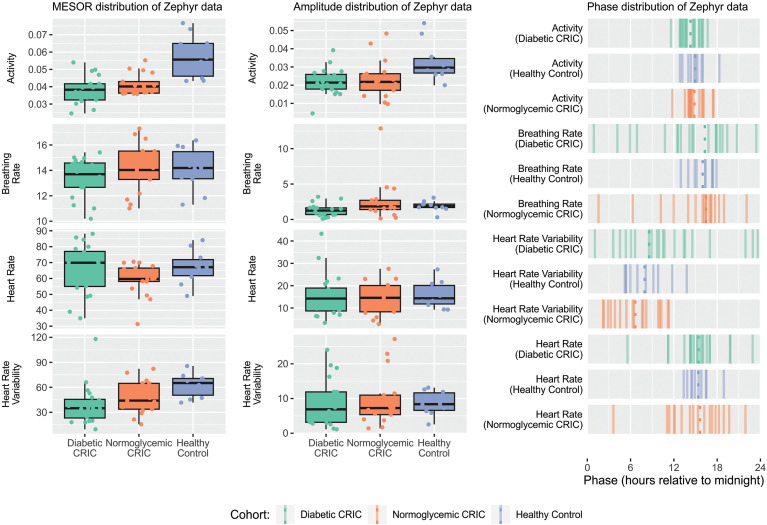
Figure 3.
Cosinor metrics of BioPatch data streams The rhythm-adjusted mean, MESOR, (Left) and amplitude (Center) for activity (g), breathing (bpm) and heart (bpm) rates, and BioPatch SDNN (standard deviation of normal-to-normal RR, ms) as heart rate variability (HRV) readout are stratified by cohort, i.e. diabetic (left) and normoglycemic (center) patient with CKD compared to healthy controls (right). Right: The time-of-day when physiological readouts peak, acrophase, is shown for activity (g), breathing (bpm) and heart (bpm) rates, and BioPatch SDNN (ms) for controls (top, blue), diabetic (center, green), and normoglycemic (bottom, orange) patient with CKD. CKD, chronic kidney disease.

