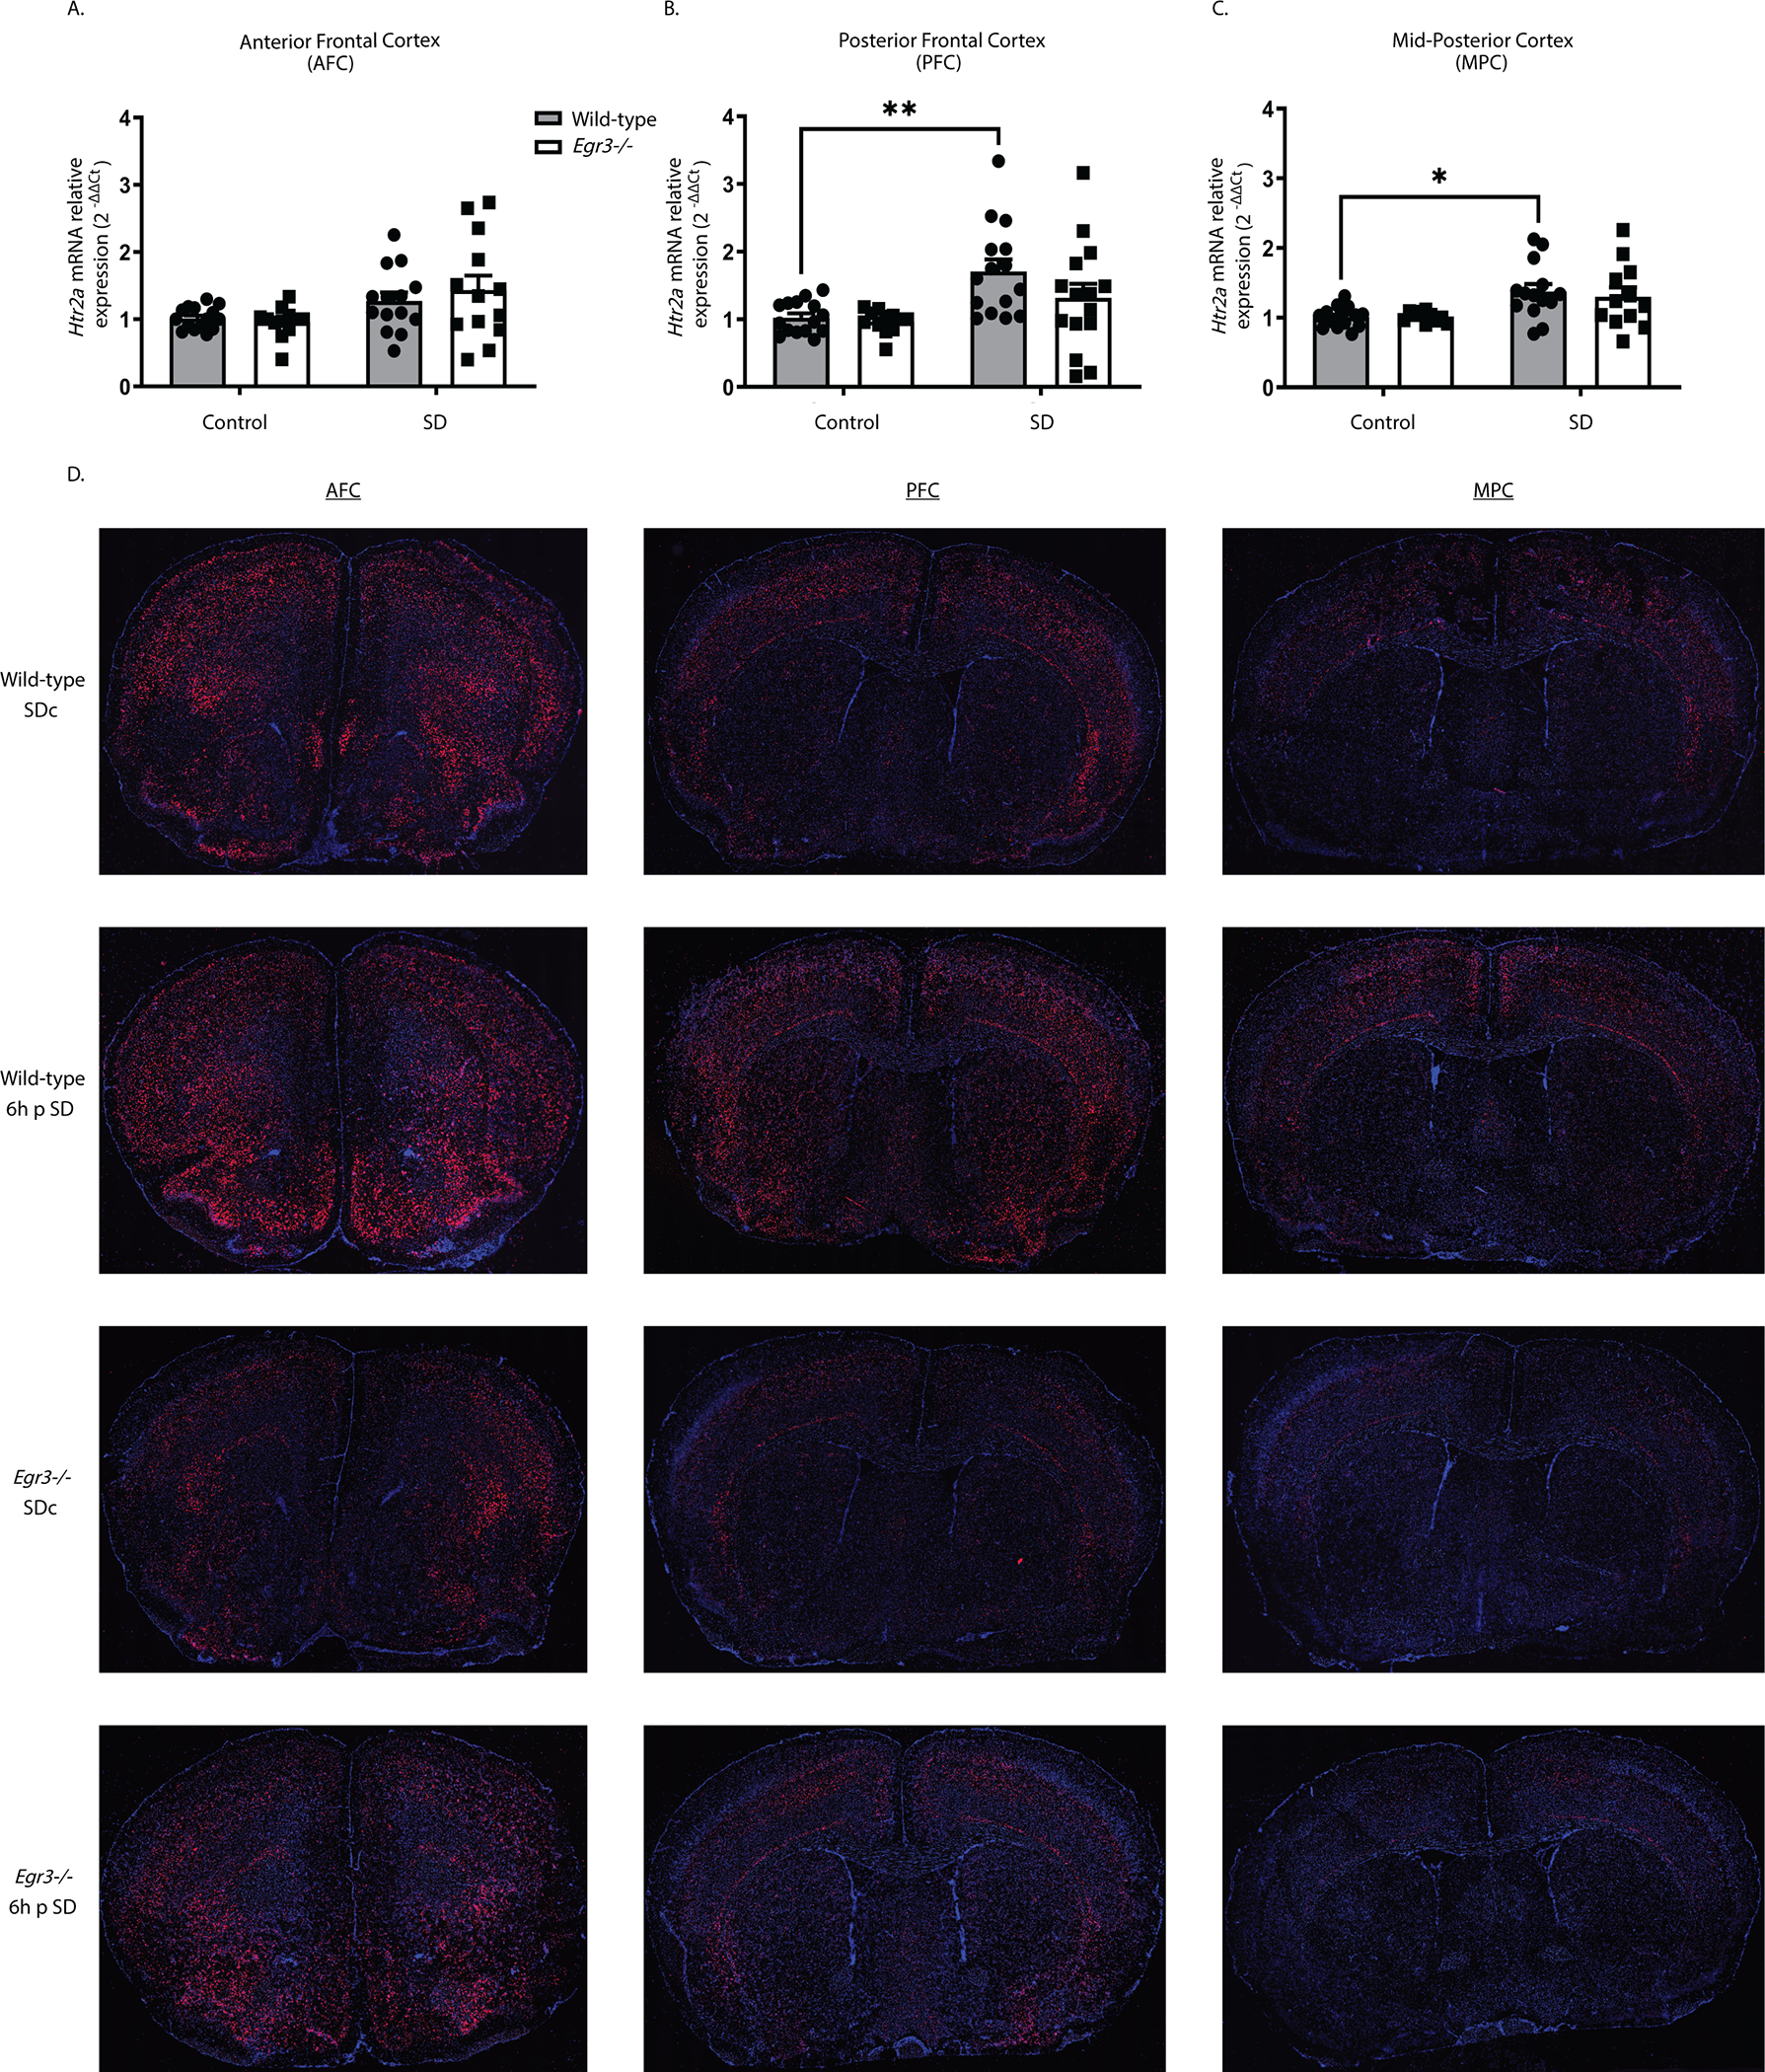
Figure 2. Sleep deprivation upregulates Htr2a in an Egr3-dependent, and region-specific, manner.

(A – C) In WT and Egr3−/− mice qRT-PCR shows that 6h of SD (A) increases Htr2a overall in the AFC when both genotypes were analyzed (two-way ANOVA, sig. main effect of SD (F1, 50 = 8.279, p = 0.0059; WT: SDc, n = 15; SD, n = 14; Egr3−/−: SDc, n = 12; SD, n = 13)) but not in either genotype alone (post-hoc analyses showed no sig. differences between genotypes or SD conditions). (B) However, SD significantly upregulates Htr2a expression in the PFC of WT, but not Egr3−/−, mice, compared to SDc (two-way ANOVA, sig. main effect of SD (F 1, 53 = 12.08, p = 0.0010; WT: SDc, n = 15; SD, n = 15; Egr3−/−: SDc, n = 12; SD, n = 15); post-hoc analyses showed a sig. increase of Htr2a mRNA after SD (vs. SDc) in WT mice (p = 0.0088), but not in the Egr3 −/− mice (p = 0.6777)). (C) In the MPC, SD increased Htr2a in WT, but not Egr3−/−, mice, compared to SDc (two-way ANOVA, sig. main effect of SD (F 1,47 = 13.14, p = 0.0007; WT: SDc, n = 15; SD, n = 14; Egr3−/−: SDc, n = 10; SD, n = 12)); post-hoc analyses showed sig. increase of Htr2a mRNA after SD (vs. SDc) in WT mice (p = 0.0205) but not in the Egr3 −/− mice (p = 0.2343). (D) Representative images from n = 3 per group of RNAscope in situ hybridization demonstrating Htr2a expression in SDc and SD WT and Egr3−/− mice. Bonferroni-corrected comparisons: * p < 0.05, ** p < 0.01. Values represent means ± SEM. (Abbreviations: p - post).
