Figure 1.
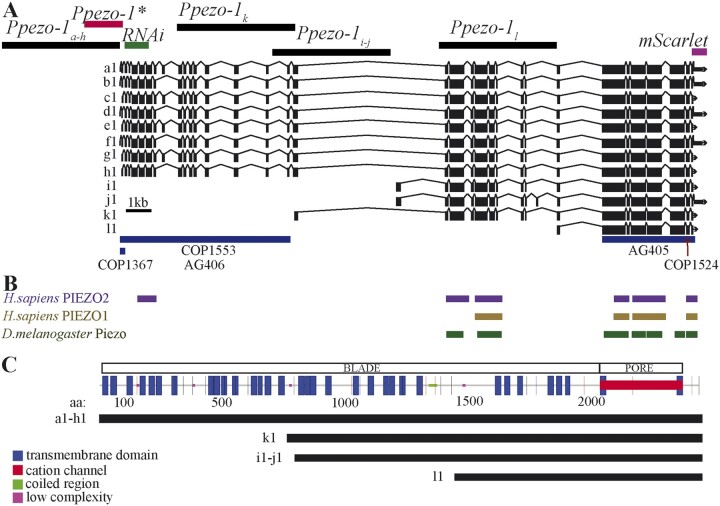
Genetic map of C. elegans’ pezo-1. (A) WormBase (Harris et al. 2020) diagram of pezo-1 showing 12 predicted isoforms (a–l). Exons are shown in black boxes separated by introns (black lines). The 5-kb sequences used to drive expression of GFP are shown targeting a–h isoforms (top left black bar), i and j, k, and l isoforms (top black bars). Also highlighted is the abbreviated promoter sequence (Ppezo-1*) used to drive GCaMP6s expression in the pharyngeal gland cells (red bar), as well as the coding sequence targeted by RNA interference (green bar). Under the diagram of pezo-1, we have indicated the location of each CRISPR mutation in blue bars (COP1367, COP1553, AG406, AG405) and red arrows (COP1524). (B) Protein similarity regions between the worm PEZO-1 and the human PIEZO1 and PIEZO2 (PIEZO1: score = 100, E-val = 4e-17, %ID = 32.7; PIEZO2: score = 82, E-val = 1e-11, %ID = 58.33), and the fruit fly Piezo (score = 666, E-val = 0.0, %ID = 27.8) obtained from WormBase through ENSEMBL, and BLASTX (Harris et al. 2020; Yates et al. 2020). The bars are shown in alignment to the gene sequence in (A). (C) Functional protein domain analysis obtained through SMART and GenomeNet Motif showing the predicted location of the cation channel (red) and the transmembrane domains that constitute the propeller blade domains of the channel (Letunic and Bork 2018; Schultz et al. 2000). The different isoform groups are aligned to show the predicted transmembrane domains present in each group (black lines).

