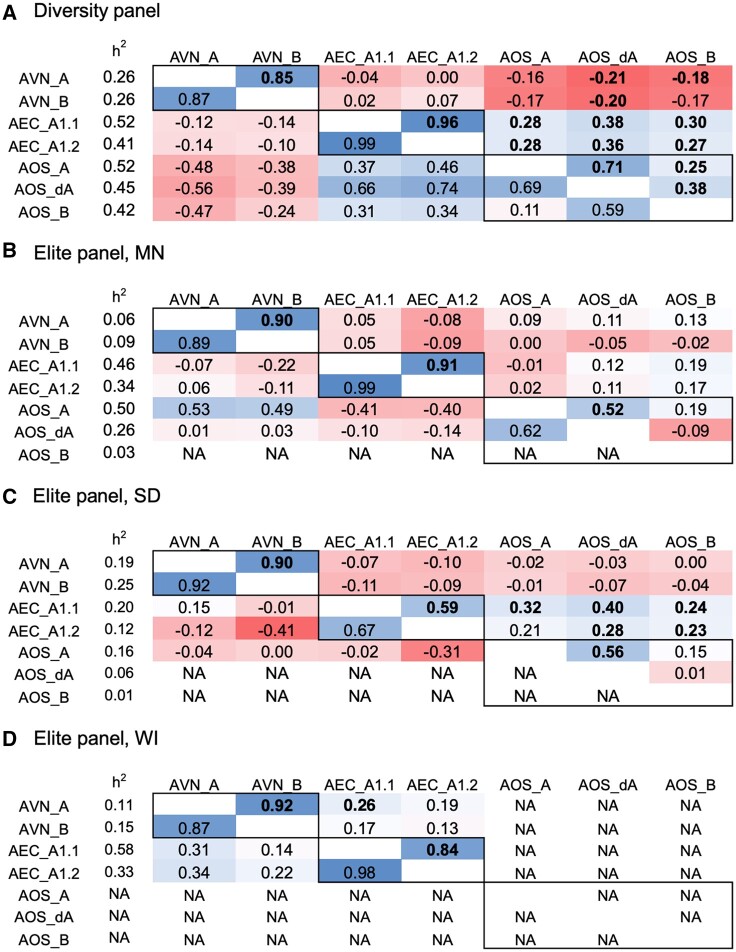
Figure 1.
Phenotypic and genetic correlation of specialized metabolites in oat seed (avenanthramides, “AVN”; avenacins, “AEC”; avenacosides, “AOS”) in (A) diverse panel evaluated only in New York, and elite panel evaluated in (B) Minnesota (“MN”), (C) South Dakota (“SD”), (D) Wisconsin (“WI”), United States. The specific type of metabolite is described in Supplementary Table S1. The values in the top diagonal are Pearson’s phenotypic correlations, where bold indicates significance at the Bonferroni cutoff, the values in the bottom diagonal are genetic correlations with no associated statistical values, and h2 is the genomic heritability.

