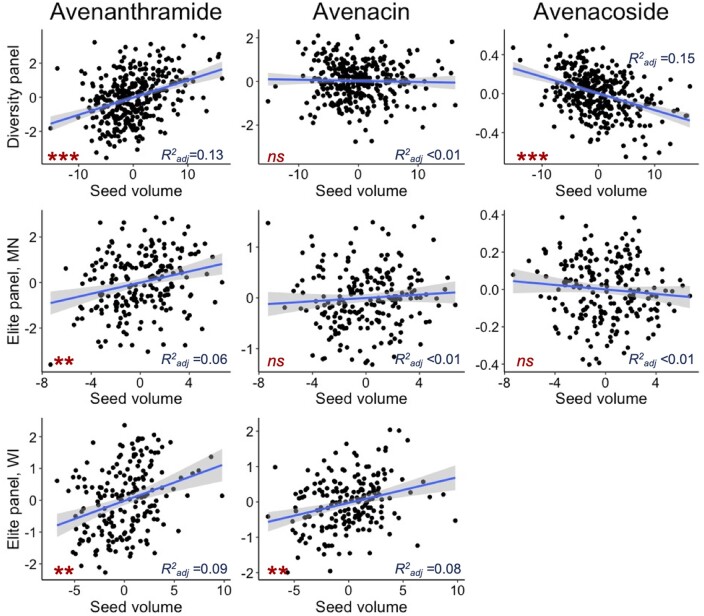
Figure 2.
Relationship between specialized metabolites and seed size in the diversity panel (evaluated only in New York) and elite panel evaluated in Minnesota (“MN”) and Wisconsin (“WI”). Data are not available for the elite panel evaluated in South Dakota. For each metabolite class, an example was chosen where “Avenanthramide” refers to avenanthramide B, “Avenacin” refers to avenacin A1.1, and “Avenacoside” refers to avenacoside A (Supplementary Table S1). Model results for all metabolites are presented in Supplementary Table S9. The ***P < 1E−6, **P < 1E−3, and “ns” indicates P > 0.05.

