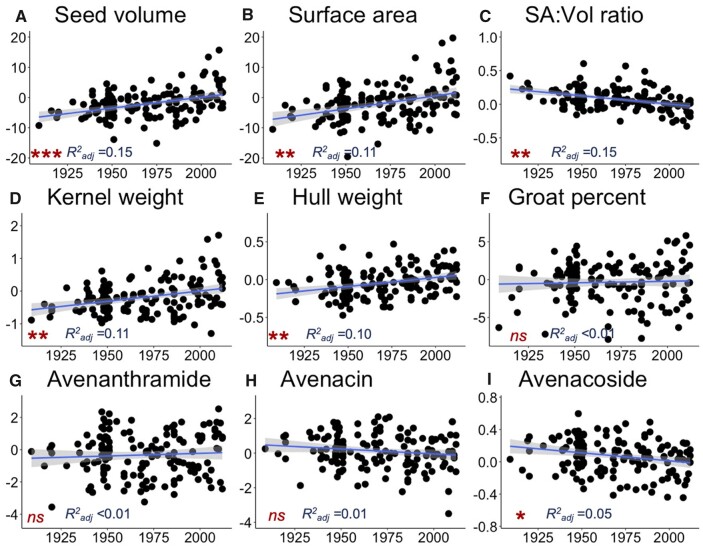
Figure 3.
Relationship between year of variety release and deregressed BLUPs of (A) seed volume, (B) seed surface area, (C) seed surface area to volume ratio, (D) HKW, (E) HHW, (F) groat percent, (G) avenanthramide, (H) an avenacin, and (I) an avenacoside in the diversity panel. For each metabolite class, an example was chosen where “Avenanthramide” refers to avenanthramide B, “Avenacin” refers to avenacin A1.1, and “Avenacoside” refers to avenacoside A (Supplementary Table S1). Model results for all traits are presented in Supplementary Table S12. ***P < 1E−6, **P < 1E−3, *P< 0.05, and “ns” indicates P> 0.05.

