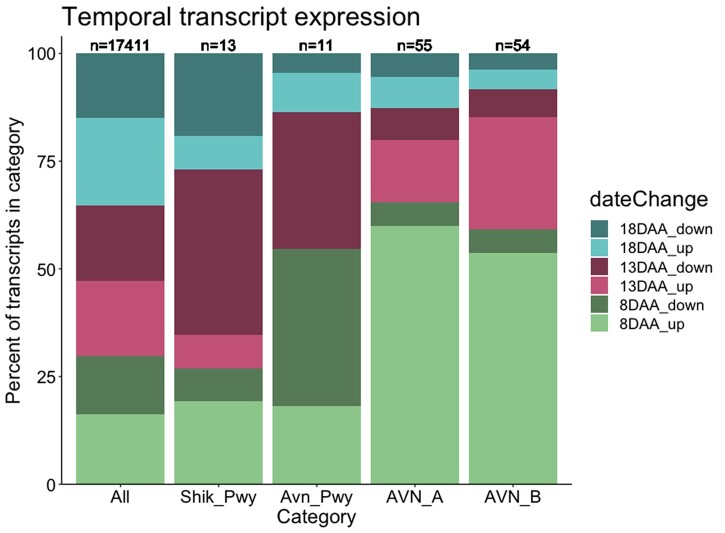
Figure 5.
Oat seed transcripts classified by temporal variant category (day after anthesis at which expression of a particular gene substantially changes during seed development) and direction (increase or decrease) as described in Hu et al. (2020), and shown by color here. The percent of transcripts in each category is shown for all transcripts in the dataset (“all”), transcripts annotated to be part of the preceding shikimate pathway (“Shik_Pwy”), transcripts annotated in avenanthramide biosynthesis (“Avn_Pwy”), and both avenanthramides (AVN_A and AVN_B). The numbers at the top indicate the number of transcripts that were annotated by temporal group.

