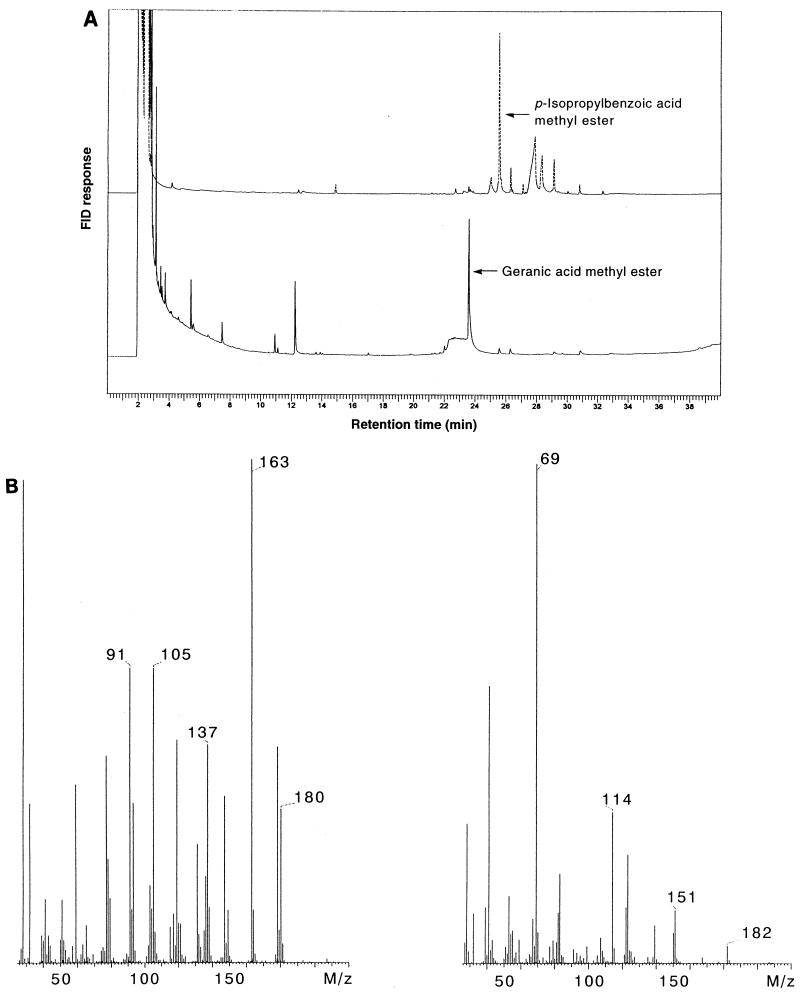
FIG. 3.
(A) Results of GC analyses of fatty acids present in the culture medium (top trace) and in cells (bottom trace) of a 10-liter fermentation of A. defragrans 65Phen. Cells were grown on 22 mM α-phellandrene (technical grade) and 100 mM nitrate. (B) Mass spectra of p-isopropyl-benzoate methyl ester (left) and of geranic acid methyl ester (right) obtained by GC-MS analyses.

