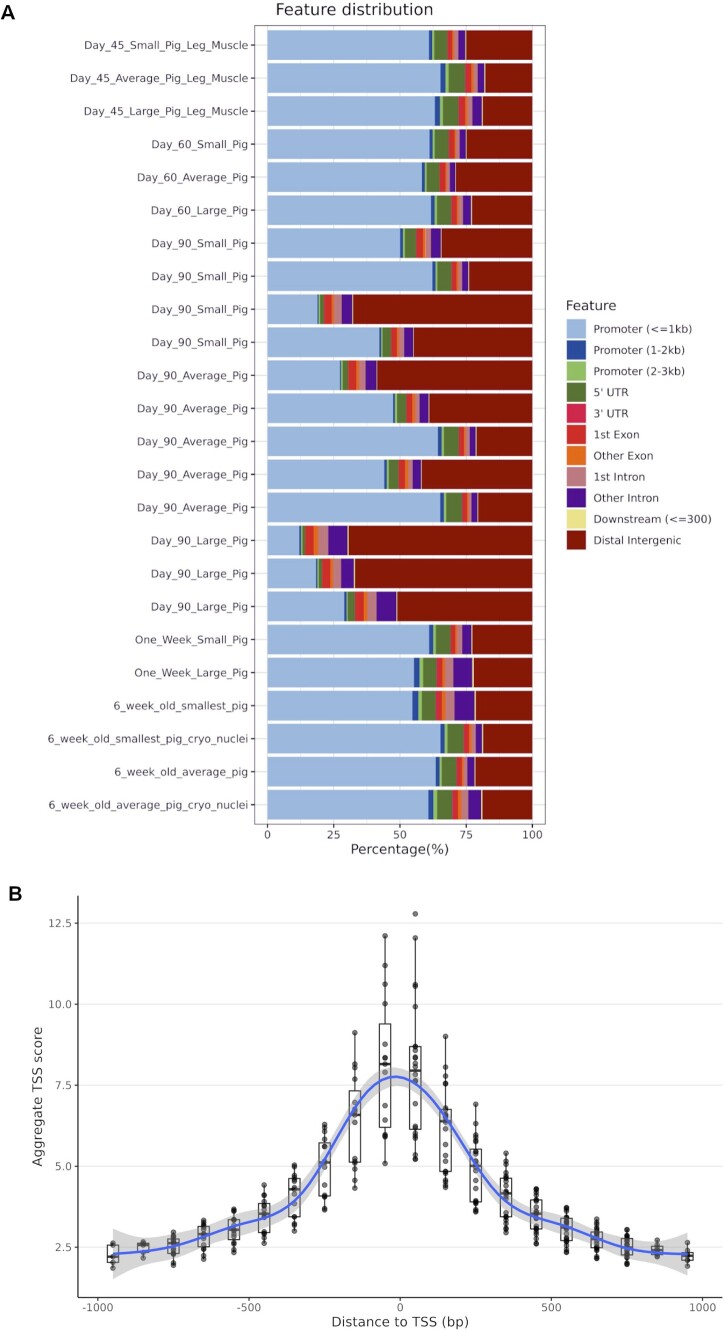
Figure 4.
(A) Percentage of ATAC-Seq peaks within genomic features. The samples are sorted by the developmental timeline (day 45 to 6 weeks old from top to bottom). (B) A boxplot graph of TSS enrichment score of ATAC-Seq peaks and their relative distance from the TSS for all 24 samples. TSS score = the depth of TSS (each 100-bp window within 1000-bp flaking TSS)/the depth of flank ends (100 bp each end). TSS-E score for each library = max [mean (TSS score in each window)] calculated by ATAC-SeqQC v1.14.4 (Ou et al. 2018).

