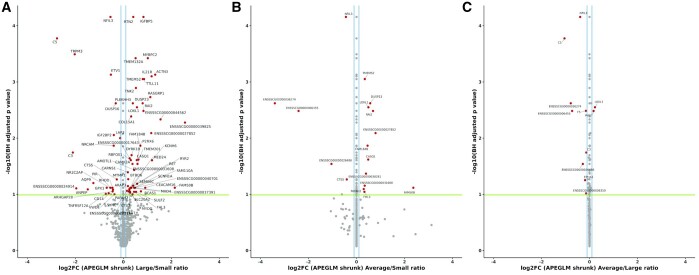
Figure 8.
Differentially expressed genes (RNA-Seq) between large-, average-, and small-sized piglets at Day 90 of gestation. (A) Large vs small, (B) average vs small, and (C) average vs large. Differentially expressed genes are shown in red, the log2FC >0.1 in blue, and the significance threshold as a green line. The ApeGLM shrinkage method was used to normalized the log fold change plotted on the x-axis as described in Love et al. (2014).

