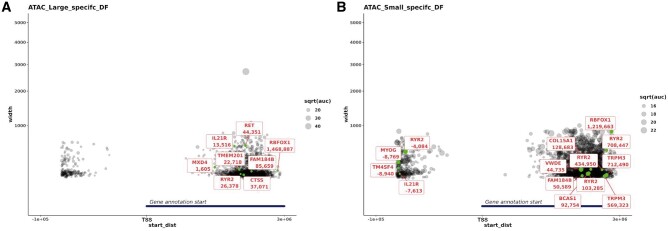
Figure 9.
Proximity of ATAC-Seq peaks specific to large (A) and small (B) piglets and differentially expressed genes. Differentially expressed genes are marked in green. The x-axis (start_dist) is the distance from the start of the gene model to the start of the ATAC-Seq peak, for +ve values the peak is either within the gene or within 10 kb of the 3′ end, and for −ve values the peak is within 10 kb of the 5′ end of the gene. The y-axis indicates the width of the peak. As the y-axis represents the width of the peak, the larger the node the wider the ATAC-Seq peak.

