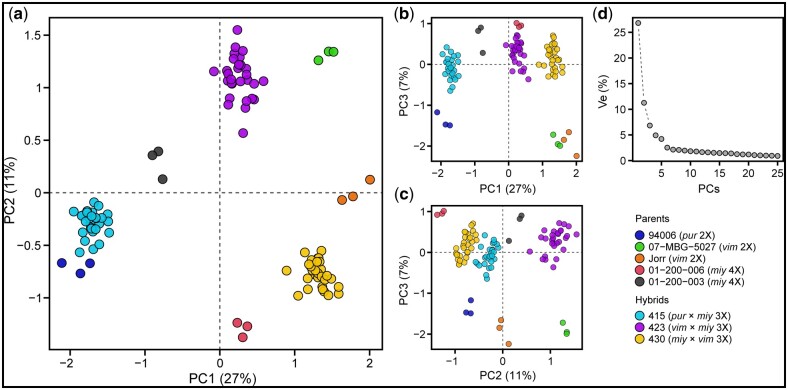
Fig. 1.
Multidimensional scaling plot of library-normalized transcriptome-wide gene expression of all triploid F1 progeny individuals (families 415, 423, and 430) and their diploid (94006, 07-MBG-5027, and Jorr’) and tetraploid (01-200-006 and 01-200-003) parents. a) PC1 vs PC2, b) PC1 vs PC3, c) PC2 vs PC3, and d) % variance explained (% Ve) by the first 25 PCs. Euclidean distances on the 2-dimensional plot approximate leading log2 fold-changes between samples, using the top 500 genes with the largest standard deviations. Parents and progeny libraries are colored according to the legend.

