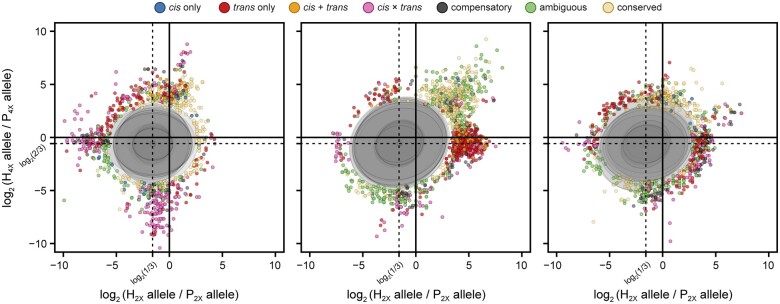
Fig. 2.
Superimposed dosage differential scatterplots of 10 individuals from each of the families 415, 423, and 430 (left to right, respectively). Each point depicts the log2 ratio of the diploid parent allele in the hybrid and the diploid parent allele in the parent against the log2 ratio of the tetraploid parent allele in the hybrid and the tetraploid parent allele in the parent. Points are colored according to their regulatory assignment. Ellipses mask most of the distribution of log2 dosage ratios (Pr = 1 × 10⁻⁵), such that points sitting outside ellipses are extreme outliers from expected dosage. Dotted lines at log2 (1/3) = −1.585 and log2 (2/3) = −0.585 represent distribution averages for diploid and tetraploid ratios, which is where the average distribution of dosage ratios is expected to occur.

