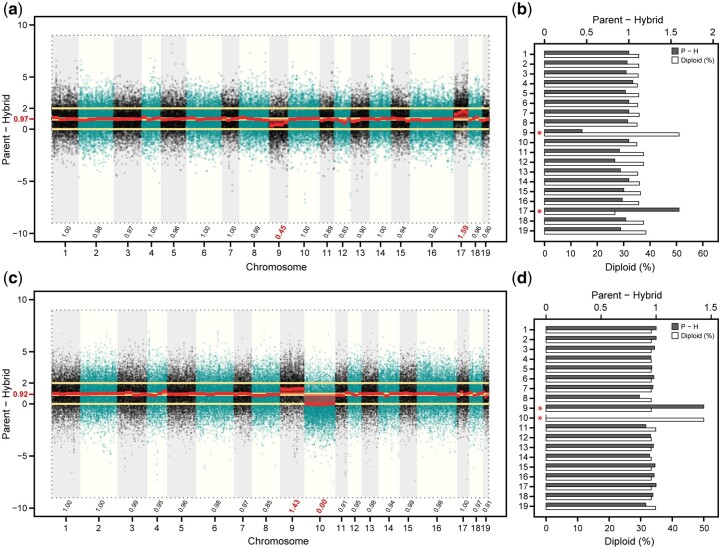
Fig. 3.
Manhattan plot showing a) chromosome-wide differences of log2 (P2X/P4X) expression (parent‒hybrid) between the family 415 parents (female diploid 94006 and male tetraploid 01-200-003) and the triploid hybrid 12X-415-031. Median parent‒hybrid values are shown above chromosome identifiers (x-axis). The barplot b) depicts the median parent‒hybrid difference (dark gray bars, scale top x-axis) and the % expression in the hybrid attributable to the diploid parent allele (white bars, scale lower x-axis) by chromosome (y-axis). The Manhattan plot in panel c) and barplot in panel (d), represent the same analyses, but between the family 423 parents (female diploid 07-MBG-5027 and male tetraploid 01-200-003) and the triploid hybrid 12X-423-070. Red text on x-axes in panels a) and d) correspond to red asterisks on y-axes in panels b) and c), which denote significant differences (Wilcoxon P-value < 1 × 10⁻¹⁶).

