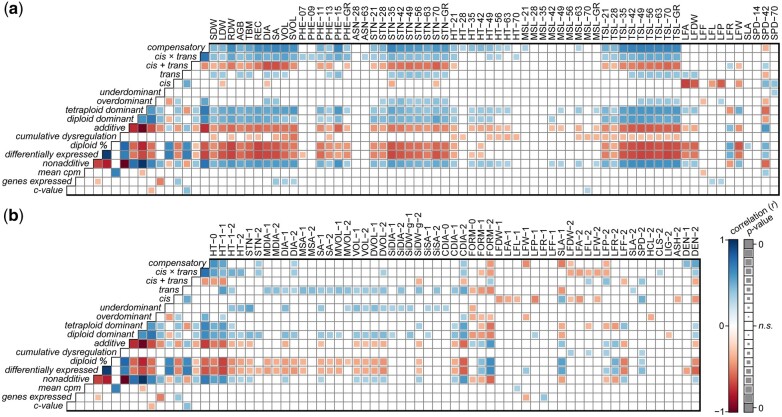
Fig. 4.
Correlations of nonadditive, regulatory divergent, and cumulative expression dysregulation class proportions in F1 progeny with heterosis values for a) greenhouse and b) field phenotypes. Pearson correlation coefficients (r), positive correlations are illustrated by filled blue squares and negative correlations by filled-red squares. Nonsignificant correlations (P-value > 0.01) were left blank. Significance levels (P-values) were used to scale the area of each square, such that smaller squares represent correlation coefficients with lower significance and larger squares represent those with greater significance.

