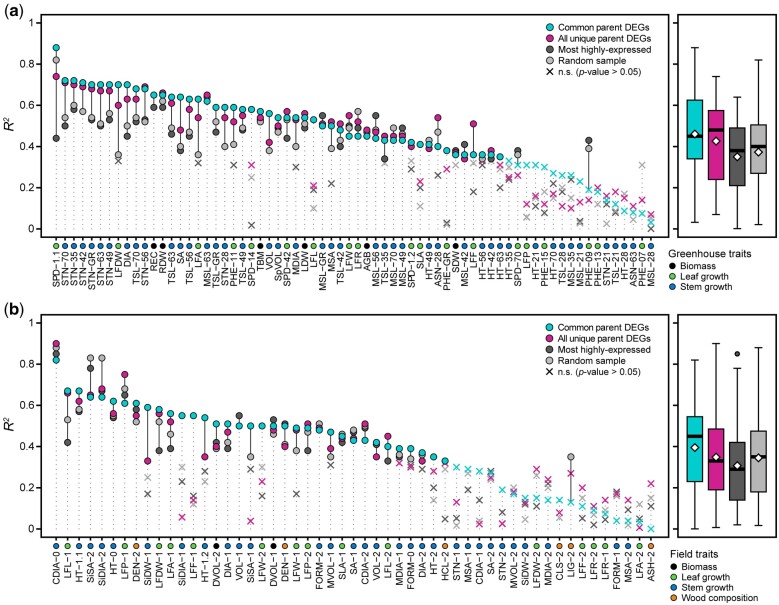
Fig. 5.
Prediction accuracies (R2) of heterosis values for a) greenhouse and b) field phenotypes (Supplementary Table 7) using selected and random gene expression sets. These 4 gene sets were: differentially expressed genes common among parent pairs (cyan, n = 379), differentially expressed genes in at least 1 parent pair (magenta, n = 4,978), the most highly expressed genes (dark gray, n = 5,000), and a random sampling of genes (light gray, n = 5,000). Boxplots to the right of each panel depict the distribution of prediction accuracies, with means represented as yellow diamond points. Traits are colored according to respective classes described in the lower left legend of each panel.

