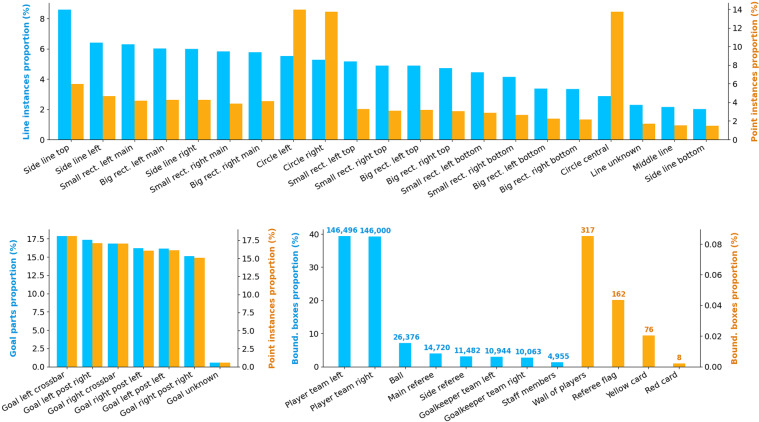
Fig. 3.
Annotation distributions. Top: distribution of the number of line instances annotated (blue), and of the number of points placed on those lines (orange). Bottom: (left) the same distributions for goal parts; (right) distribution of the bounding boxes annotated, all classes included, with the corresponding number of boxes. A different scale is used for rare objects (orange) for the sake of clarity. Those distributions are computed from our public annotations of 400 SoccerNet games.

