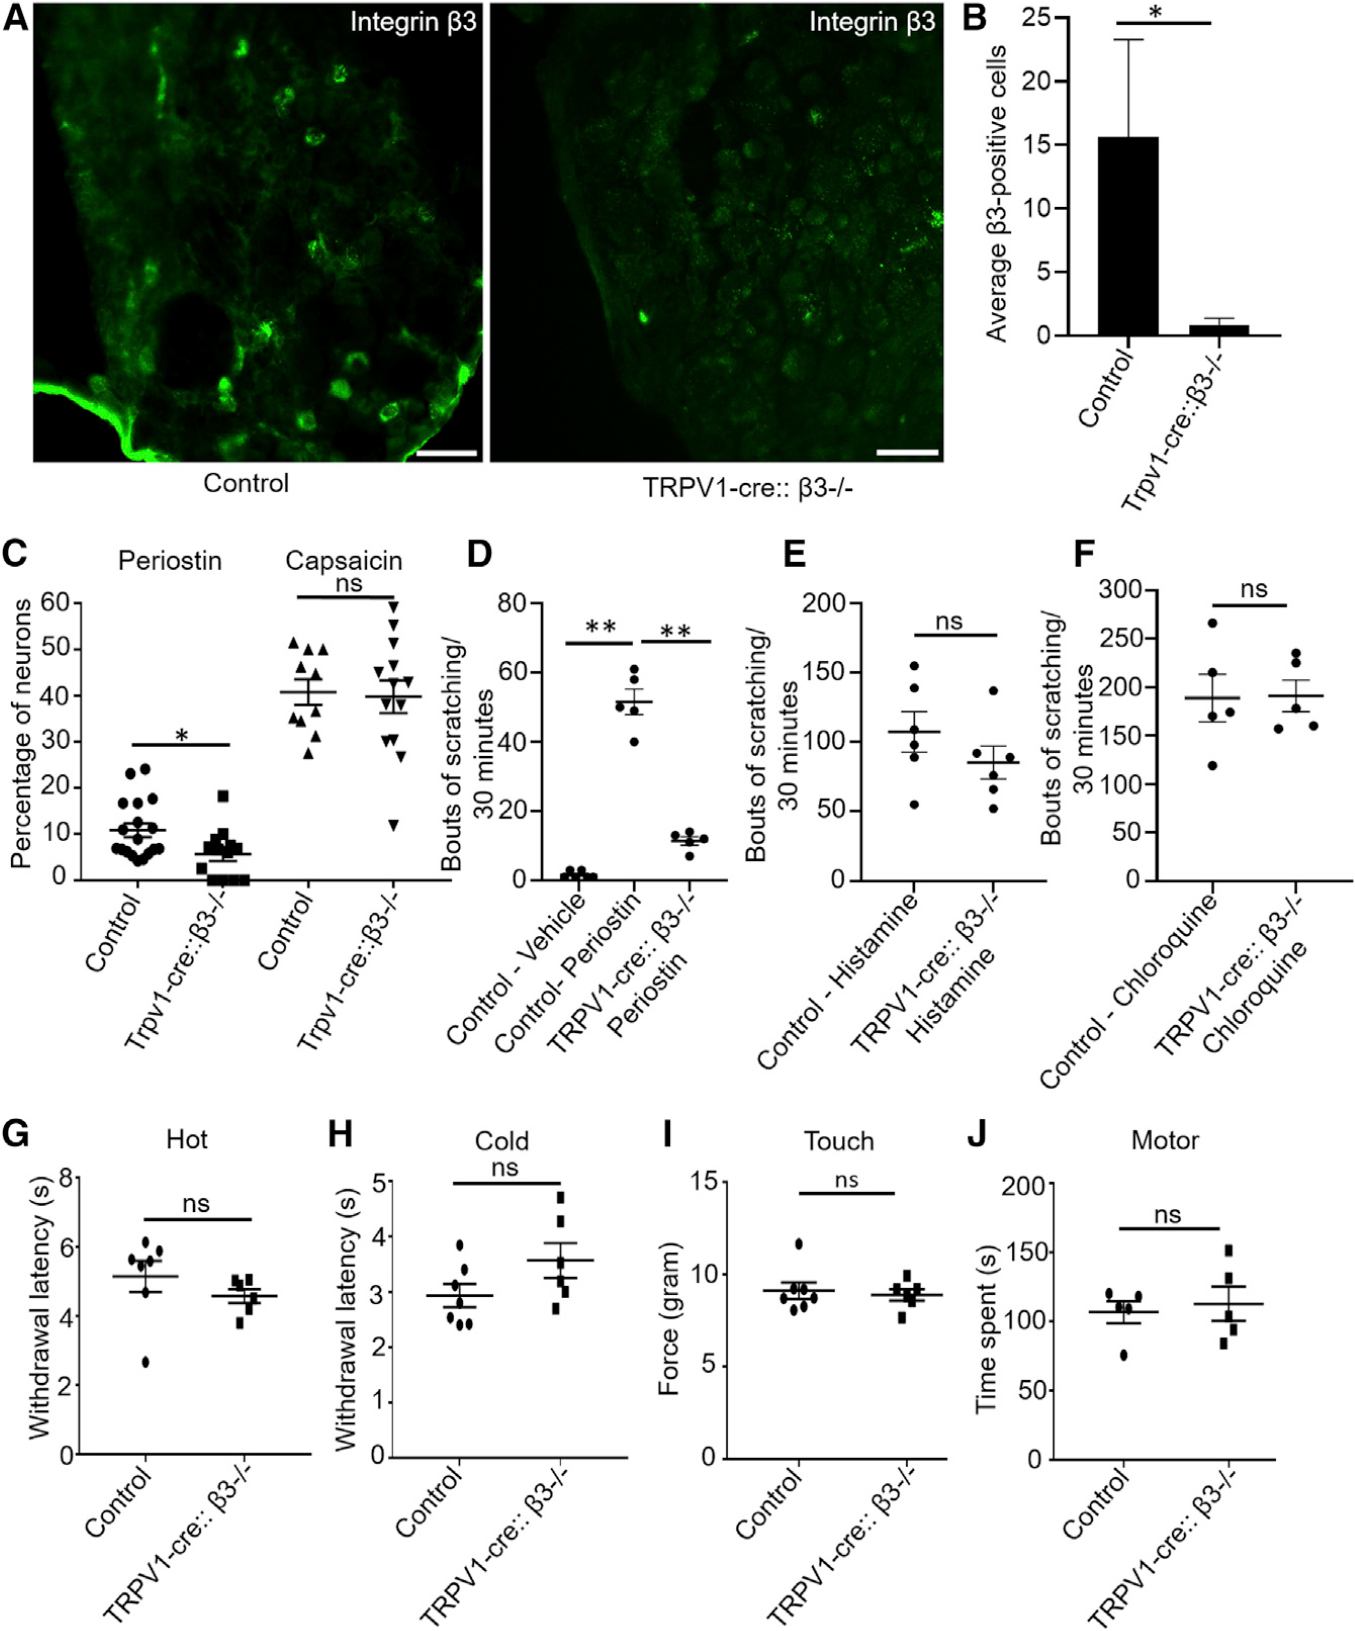
Figure 5. The Periostin-Mediated Itch Behavior Implicates the Integrin Receptor αVβ3 in TRPV1-Expressing Neurons.

(A) IHC showed the elimination of β3 in TRPV1-cre::β3−/− mice compared with either TRPV1-cre or β3fl/fl alone as control. Scale bar, 75 μm.
(B) Quantification of β3-immunopositive cells of DRGs from the TRPV1-cre::β3−/− mice demonstrated a significant reduction compared with control littermates (β3fl/fl). n = 3–4 mice, and an average of 3 sections from each mice was quantified.
(C) Periostin-mediated calcium response is reduced in TRPV1-cre::β3−/− mice, but there was no change in the capsaicin-induced calcium influx. n = 3–4 mice, and each data point represents one coverslip.
(D) Itch behavior following the injection in the nape of the neck of vehicle (PBS) or periostin in control and mutant (TRPV1-cre::β3−/−) mice. Periostin-induced itch was significantly reduced in mutant mice compared with control littermates. n = 5–6 mice per group.
(E) Itch response to i.d. injection of histamine in control littermates and mutant (TRPV1-cre::β3−/−) mice remained normal. n = 6 mice per group.
(F) Itch response to i.d. injection of chloroquine in control and TRPV1-cre::β3−/− mice remained normal. n = 5 mice per group.
(G) Hargreaves assays between control and mutant (TRPV1-cre::β3−/−) littermates. Both control and mutant mice had a normal withdrawal latency. n = 6–7 per group
(H) Dry-ice cold assays between control and mutant (TRPV1-cre::β3−/−) littermates. Both control and mutant mice showed normal behavior responses. n = 6–7 per group
(I) Touch (von Frey) tests between control and mutant (TRPV1-cre::β3−/−) littermates. Both control and mutant mice demonstrated normal behavior responses. n = 6–7 per group
(J) Rotarod test shows motor deficits between control and mutant (TRPV1-cre::β3−/−) littermates. Both control and mutant mice had normal behavior responses. n = 5 per group.
All data were presented as mean ± SEM. One-way ANOVA Dunn’s test was performed for equal or more than three groups (**p < 0.001), and unpaired Student’s t test was performed to determine significance (*p ≤ 0.01).
