
Figure 2.
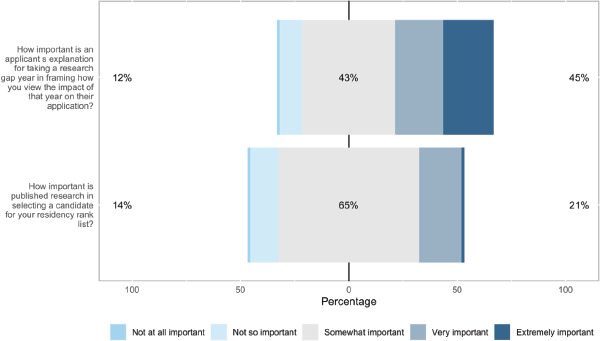
Likert plot representation of program director responses to questions #11 and #17. Corresponding colors are immediately to the left of each response level.
Official websites use .gov
A
.gov website belongs to an official
government organization in the United States.
Secure .gov websites use HTTPS
A lock (
) or https:// means you've safely
connected to the .gov website. Share sensitive
information only on official, secure websites.
Likert plot representation of program director responses to questions #11 and #17. Corresponding colors are immediately to the left of each response level.