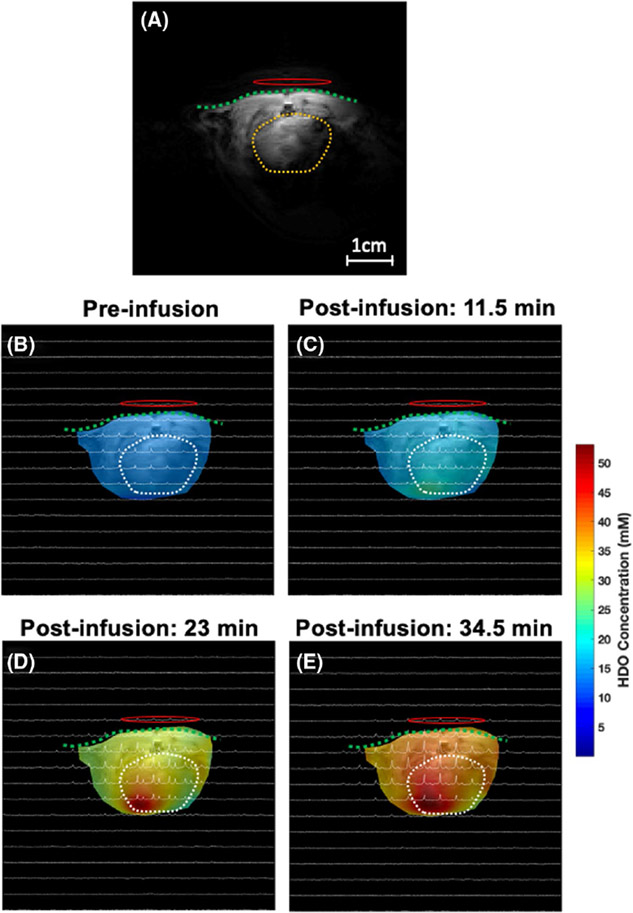
FIGURE 8.
Similar to Figure 7, the color code in each image shows the HDO concentration at different voxels acquired before (baseline) (B) and 11.5 min (C), 23 min (D), and 34.5 min (E) after the [2,2,2-d3]-acetate infusion (approximately 1 min per CSI acquisition time) and confirms that the HDO concentration increases with time. The green dash line and yellow/white dash circle represent the chest wall and heart region, respectively. The 1H/2H dual frequency RF surface coil was placed near the rat heart as indicated by a red oval-shaped circle

