
Fig. 3.
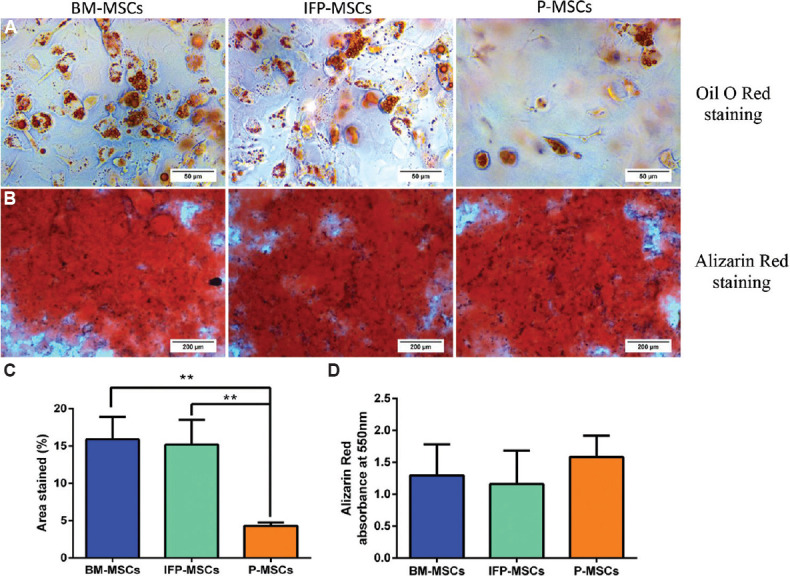
Adipogenic and osteogenic differentiation potential of MSCs from three sources. (A) Oil O Red staining showed lipid droplet formation in BM- MSCs, infrapatellar fat pad- MSCs and P- MSCs. (B) Light microscopic images showed the calcium deposits stained with Alizarin Red staining. (C) Percentage of area stained with Oil Red O indicates BM- MSCs and infrapatellar fat pad- MSCs formed significantly higher lipid droplets than P- MSCs. P **<0.01. (D) Quantification of Alizarin Red staining indicates MSCs from all three tissues deposited similar amount of calcium with no significant difference. MSC, mesenchymal stem cells.