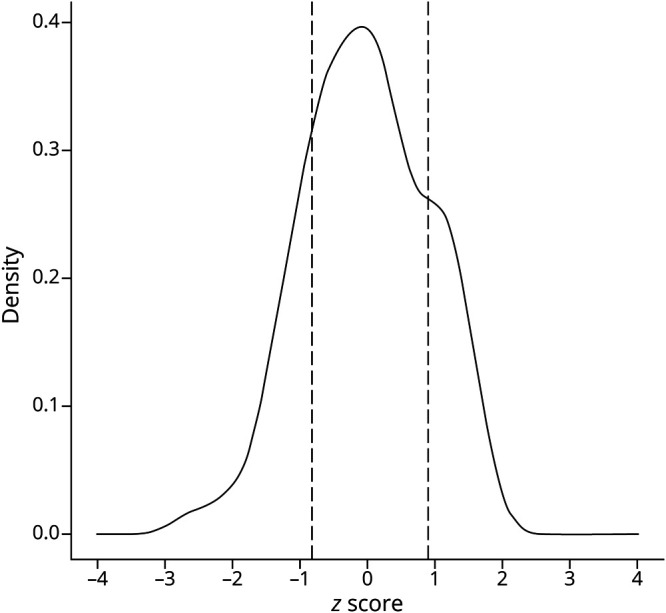
Figure 2. Genetic Risk Score Distribution.

Density plot for the PD genetic risk score. Z scores reflect standard deviations from the mean. The low- and high-risk groups are indicated by dashed lines, highlighting cutoffs for the first and fifth quintiles, respectively. PD = Parkinson disease.
