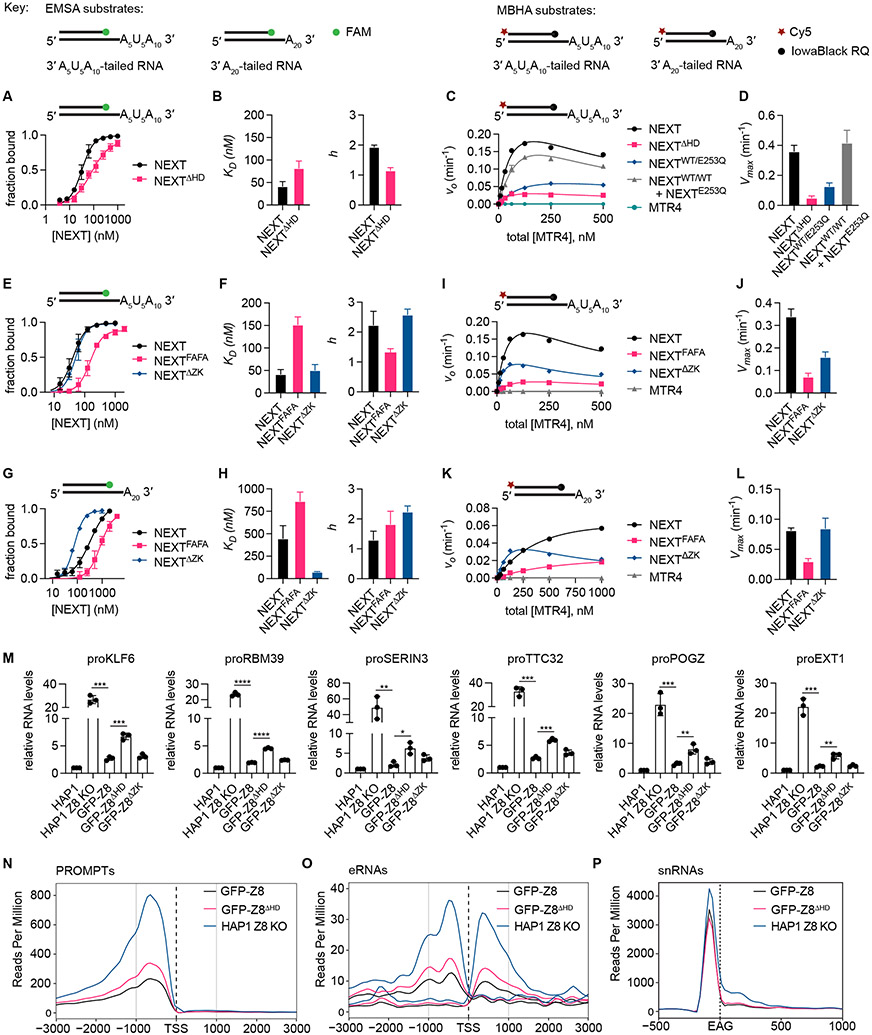
Figure 5. Biochemical, qPCR, and RNAseq analysis of NEXT and variants.
(A) EMSA plots comparing NEXT and NEXTΔHD binding to 3′ A5U5A10-tailed RNA duplex substrate. Data points represent mean ± SD from three technical replicates.
(B) Bar graphs of dissociation constants KD (mean ± SEM) and Hill coefficients h (mean ± SEM) obtained from fitting the EMSA data in (B) to Hill equation.
(C) Graph of initial strand displacement rate (v0) at varying protein concentration (plotted as equivalent molar concentration of MTR4) for WT NEXT, NEXT with ZCCHC8 HD deleted (NEXTΔHD), heterodimeric NEXTWT/EQ containing wild-type MTR4 and MTR4 E253Q mutant, and a stoichiometric mixture of wild-type NEXTWT/WT and helicase-dead NEXTEQ/EQ. Assays were performed using 3′ A5U5A10-tailed RNA duplex substrate. Data points are shown as mean ± SD from three separate reactions.
(D) Bar graphs of Vmax (mean ± SEM) obtained by fitting the data in (A) to equation v0 = Vmax*[E]/(K1/2 + [E]*/(1+[E]/K′1/2)).
(E) EMSA plots comparing NEXT with RBM7 F13A/F52A mutations (NEXTFAFA) and NEXT with ZCCHC8 ZK deleted (NEXTΔZK) binding to 3′ A5U5A10-tailed RNA duplex substrate.
(F) Bar graphs of KD (mean ± SEM) and h (mean ± SEM) obtained from fitting the EMSA data in (E) to Hill equation.
(G) EMSA plots comparing NEXT, NEXTFAFA, and NEXTΔZK binding to 3′ A20-tailed RNA substrate. Data points in (E) and (G) represent mean ± SD from three technical replicates.
(H) Bar graphs of KD (mean ± SEM) and h (mean ± SEM) obtained from fitting the EMSA data in (G) to Hill equation.
(I) v0 at varying protein concentration (plotted as equivalent molar concentration of MTR4) for NEXT, NEXTFAFA, NEXTΔZK, and MTR4. Assays were performed with 3′ A5U5A10-tailed RNA substrates.
(J) Bar graphs of Vmax (mean ± SEM) obtained by fitting the data in (I) to equation v0 = Vmax*[E]/(K1/2 + [E]*/(1+[E]/K′1/2)).
(K) v0 at varying protein concentration (plotted as equivalent molar concentration of MTR4) for NEXT, NEXTFAFA, NEXTΔZK, and MTR4. Assays performed with 3′ A20-tailed RNA substrates. Data points for (I) and (K) are shown as mean ± SD from three separate reactions.
(L) Bar graphs of Vmax (mean ± SEM) obtained by fitting the data in (K) to equation v0 = Vmax*[E]/K1/2 + [E]*/(1+[E]/K′1/2)) for NEXTΔZK or v0 = Vmax [E]/K1/2 for WT NEXT and NEXTFAFA.
(M) Bar graph of relative RNA levels (mean ± SD) obtained from qPCR analysis of PROMPTS in parental HAP1 cells, ZCCHC8 CRISPR knockout HAP1 cells (HAP1 Z8 KO), and stable clones of ZCCHC8 knockout HAP1 cells complemented with GFP-tagged ZCCHC8 (GFP-Z8), ZCCHC8 with HD deleted (GFP-Z8ΔHD) or ZCCHC8 with ZK deleted (GFP-Z8ΔZK). Individual data points from three biological replicates are shown as solid circles. Data were normalized relative to RNA levels in parental line. Statistical analysis was performed using two-tailed t test. P values are indicated by *p < 0.05, **p <0.01, ***p <0.001; ****p < 0.0001.
(N) Density profiles of RNA seq (−) strand reads around protein-coding genes and long intergenic RNA transcript transcription start sites (TSSs) within 3 kb upstream and downstream of PROMPTS.
(O) Read density plot upstream and downstream of eRNAs TSSs. Both (+) and (−) strand reads are shown.
(P) Read density 500 bp upstream and 1 kb downstream of 3′ ends (EAG) of all snRNAs. Each sample in Figures 5O-5Q is labeled and colored uniquely. See also Figure S8.

