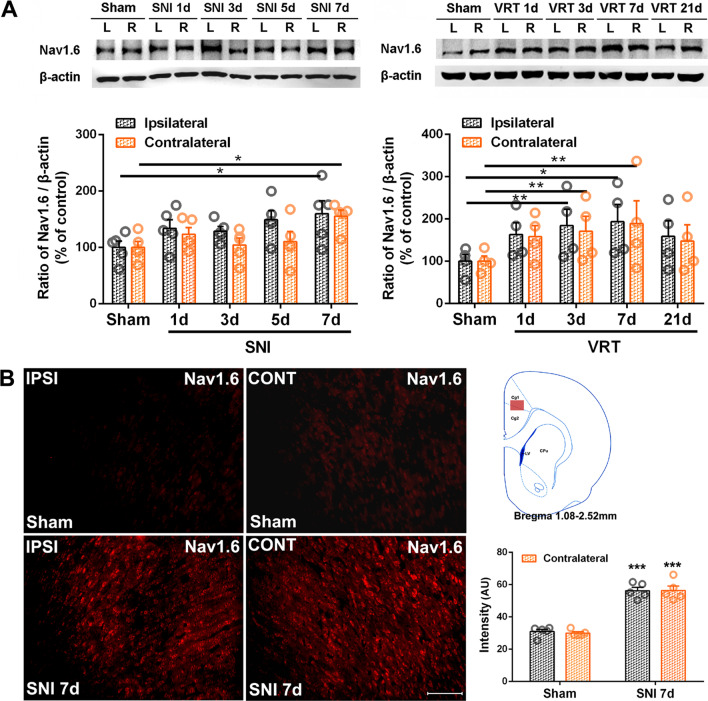
Fig. 6.
Analysis of the difference in protein levels of Nav1.6 in ACC induced by SNI and L5-VRT. A Representative western blotting of Nav1.6 protein levels in bilateral ACC following SNI and L5-VRT are shown on the top and the quantification results are shown below. *p < 0.05, **p < 0.01 versus sham group (one-way ANOVA). B The expression of Nav1.6-positive cells in bilateral ACC 7d post-SNI surgery. Representative data obtained from sham and SNI rats are shown. Scale bar = 100 μm. Detection area by red solid rectangular box is shown on the upper right and mean fluorescence intensity is shown on the lower right. ***p < 0.001 versus sham group (one-way ANOVA)

